Hong Kong Exchanges and Clearing Limited’s (HKEx) Cash Market Transaction Survey 2009/10 (covering HKEx’s securities market turnover from October 2009 to September 2010) found that the contribution to the total trading value of HKEx’s securities market from local and overseas investors continues to be well balanced.
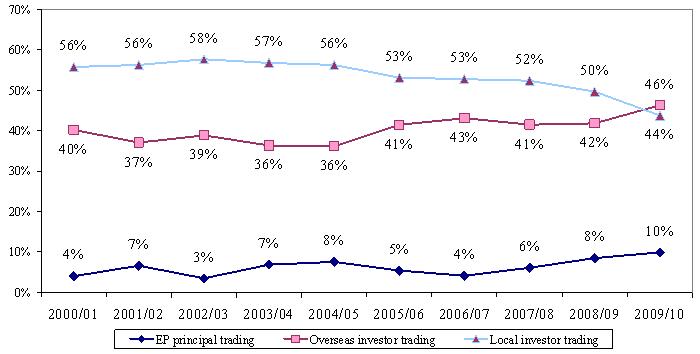
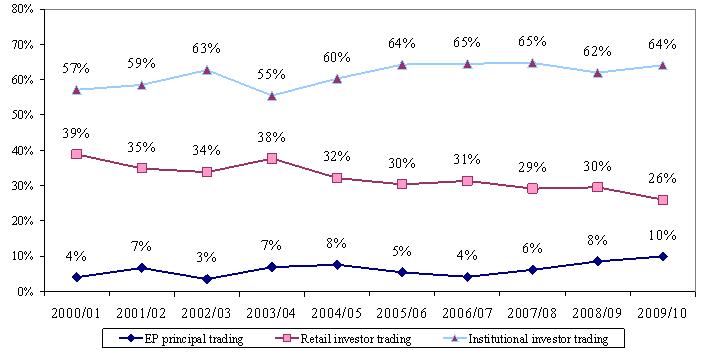
In 2009/10, overseas investors contributed 46 per cent of total market turnover value, up from 42 per cent in 2008/09, while local investors contributed 44 per cent, down from 50 per cent in the previous year. Institutional investors contributed 64 per cent of total market turnover value (62 per cent in 2008/09), remaining above 60 per cent for the fifth consecutive year. The contribution from retail investors was 26 per cent in 2009/10, down from 30 per cent in the previous year (see Figures 1 and 2).
Some other key findings of the 2009/10 survey
-
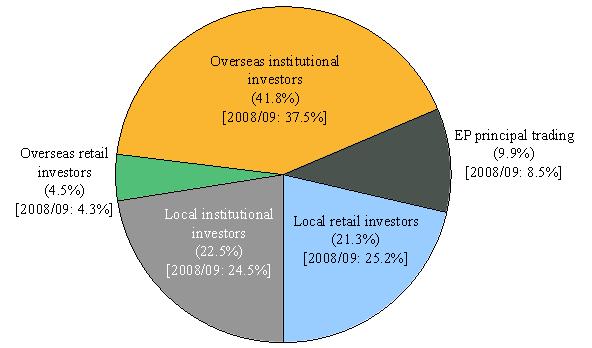
Overseas institutional investors, the largest contributors among all investor types, contributed 42 per cent of total market turnover, up from 38 per cent in 2008/09 (see Figure 1).
-
Local institutional investors contributed 23 per cent to total market turnover, compared to 24 per cent in 2008/09 (see Figure 1).
-
Local retail investors contributed 21 per cent to total market turnover, compared to 25 per cent in 2008/09 (see Figure 1).
-
Exchange Participants’ principal trading contributed a record high of 10 per cent of total market turnover in 2009/10, up from 8 per cent in 2008/09 (see Figure 1).
-
Findings regarding trading value by overseas investors (see Figure 3) show that:
-
UK investors regained their status as the largest contributors to overseas investor trading in 2009/10 with a contribution of 29 per cent, up from 23 per cent in 2008/09.
-
US investors, ranking behind UK investors for the first time since surpassing them in 2004/05, contributed 24 per cent of overseas investor trading in 2009/10, down sharply from 36 per cent in 2008/09.
-
The contribution from Continental European investors to overseas investor trading rebounded from 10 per cent in 2008/09 to 16 per cent in 2009/10, ranking third among overseas investors.
-
The contribution of investors from Mainland China to overseas investor trading was 11 per cent in 2009/10, compared to 12 per cent in 2008/09.
-
Asian investors in aggregate contributed 27 per cent of overseas investor trading in 2009/10, compared to 26 per cent in 2008/09.
-
There were about 20 reported origins of overseas investors in Asia and over 30 reported origins of overseas investors outside Asia, Europe and the US.
- Retail online trading accounted for 27 per cent of total retail investor trading and 7 per cent of total market turnover, up from the corresponding levels in 2008/09 (see Figure 4).
The Cash Market Transaction Survey has been conducted annually since 1991. For the 2009/10 survey, questionnaires were sent to a target population of 455 Exchange Participants. The response rate was 90 per cent by number and 99 per cent by turnover value of the target respondents.
The full report on the Cash Market Transaction Survey 2009/10 is available on the HKEx website.
Notes:
-
Cash market, securities market and stock market are interchangeable and refer to shares, bonds, funds, derivative warrants and other products traded on The Stock Exchange of Hong Kong Limited, a wholly-owned subsidiary of HKEx.
-
Stock Exchange Participant, or EP, principal trading is trading on the EP firm’s own account.
-
Retail online trading refers to trading
originating from orders entered directly by individual/retail investors and channelled to brokers via electronic media (eg the Internet).
-
The survey’s target respondents were EPs. Their responses stemmed from their own understanding of their clients. HKEx had no direct access to EPs’ clients, nor could it verify their identities.
- One of the limitations of the survey is that EPs might not know the true origins of all their client orders. For instance, an EP might classify transactions for a local institution as such when in fact the orders originated overseas and were placed through that local institution, or vice versa. In some cases, EPs might not be able to identify the composition of orders channelled via banks (which might be regarded as their institutional clients). As a result, the findings may deviate somewhat from the true picture.
|
|
|
Note: Numbers may not add up to 100 per cent due to rounding.
|
|
(a)
Local vs overseas
|
|
|
|
(b)
Retail vs institutional
|
|
|
|
Note: Numbers may not add up to sub-totals or 100 per cent due to rounding.
|
| # |
Reported origins in “Rest of Asia” were Brunei, Cambodia, India, Indonesia, Kazakhstan, Korea, Laos, Macau, Malaysia, Myanmar, Pakistan, Philippines, Sri Lanka, Thailand and Vietnam. |
| * |
Reported origins in “Others” included Anguilla, Argentina, Bahamas, Bahrain, Belize, Bermuda, Brazil, British Virgin Islands, Canada, Cayman Islands, Chile, Colombia, Cyprus, Dubai, Ecuador, Fiji, Gambia, Ghana, Guatemala, Isle of Man, Israel, Jamaica, Kuwait, Liberia, Marshall Islands, Mauritius, Mexico, New Zealand, Oman, Panama, Qatar, Republic of Seychelles, Saint Kitts and Nevis, Samoa, Saudi Arabia, South Africa, Turkey, United Arab Emirates and Venezuela. |
| Note: |
Numbers may not add up to 100 per cent due to rounding. |