Exchange Participants’ principal trading and investor trading maintained a roughly equal contribution to HKEx’s derivatives market turnover from July 2010 to June 2011, according to Hong Kong Exchanges and Clearing Limited’s (HKEx) Derivatives Market Transaction Survey 2010/11. The survey also found an increasing majority of retail investor trading was online.
In 2010/11, the turnover for the futures and options under study was 127 million contracts (referred to as the total market turnover in this survey), up 27 per cent from 99 million contracts in 2009/10. Stock options remained the dominant product by turnover, contributing 55 per cent of the total market turnover (as measured by contract volume) (see Figure 1).
Some key findings of the 2010/11 survey
-
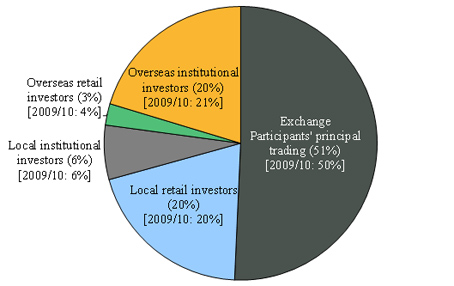
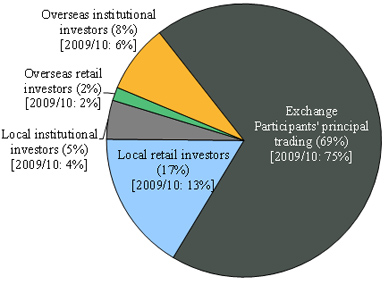
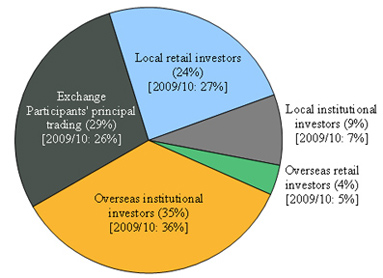
EP principal trading (comprising market maker trading and EP proprietary trading) contributed 51 per cent of total market turnover (compared to 50 per cent in 2009/10), 69 per cent of stock options turnover (down from 75 per cent in 2009/10) and 29 per cent of turnover in other futures and options (up from 26 per cent in 2009/10) (see Figure 2).
-
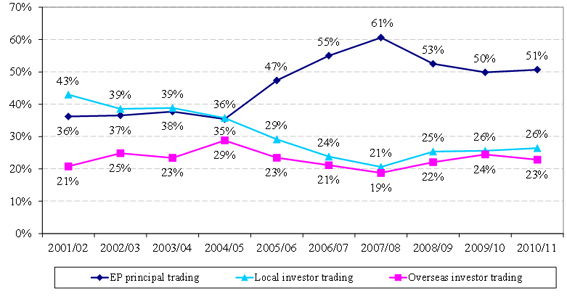
Local investors contributed 26 per cent of total market turnover (the same level in 2009/10), and overseas investors contributed 23 per cent (compared to 24 per cent in 2009/10) (see Figure 3).
-
Retail investors contributed 23 per cent of total market turnover (compared to 24 per cent in 2009/10), mostly from local retail investors (20 per cent). Institutional investors contributed 27 per cent in 2010/11 (the same level in 2009/10), mostly from overseas institutional investors (20 per cent) (see Figures 2 and 3).
-
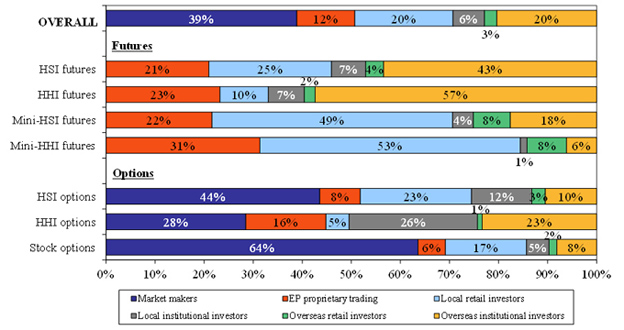
Major products (see Figure 4):
-
For Hang Seng Index (HSI) futures, overseas institutional and local retail investors were the major contributors (43 per cent and 25 per cent of the product’s turnover, respectively).
-
For H-shares Index (HHI) futures, overseas investors were the major contributors (close to 60 per cent: 57 per cent from institutions, 2 per cent from individuals).
-
For Mini-HSI futures, the major contributor was local retail investors (49 per cent) with a significant contribution from overseas investors as well (25 per cent: 18 per cent from institutions).
-
For Mini-HHI futures, local retail investors were the dominant participant type (53 per cent) while EP principal trading was also significant (31 per cent).
-
For HHI options, EP principal trading was the major contributor (45 per cent) while both local and overseas institutional investors’ contributions were also significant (26 per cent and 23 per cent respectively).
-
For stock options and HSI options, EP principal trading was dominant (69 per cent and 52 per cent respectively), and local retail investor trading was significant (17 per cent and 23 per cent respectively).
-
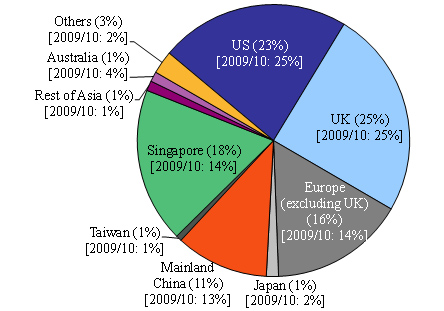
Among overseas investors, UK investors were the largest contributor to overseas investor trading (25 per cent in 2010/11, the same as in 2009/10). They were followed by US investors (23 per cent in 2010/11, down from 25 per cent in 2009/10). The contribution from Singaporean investors ranked third (18 per cent, up from 14 per cent in 2009/10). Mainland investors contributed 11 per cent of overseas investor trading and one-third of the trading from Asia (excluding Hong Kong). (See Figure 5).
-
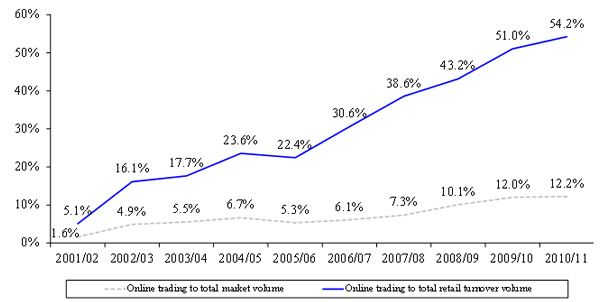
Retail online trading contributed 54 per cent of total retail investor trading (51 per cent in 2009/10) and 12 per cent of total market turnover (the same level in 2009/10) (see Figure 6).
The Derivatives Market Transaction Survey has been conducted annually since 1994 (by Hong Kong Futures Exchange on its market prior to 2001). The latest survey covers HSI futures, HSI options, Mini-HSI futures, HHI futures, HHI options, Mini-HHI futures (launched on 31 March 2008 and was included in the survey for the first time) and stock options. These products together accounted for 99 per cent of the total turnover of the HKEx derivatives market during the study period of the 2010/11 survey. The survey had an overall response rate of 89 per cent and the respondents contributed 98 per cent of the total turnover in products under study during the study period.
The full report on the HKEx Derivatives Market Transaction Survey 2010/11 is available on the HKEx website.
Notes:
-
“Market turnover” in the report refers to the total turnover, measured in contracts traded, of the products under study.
-
Due to their dominance by contract volume, stock options have a large influence on the trading pattern of the HKEx derivatives market even though they have much smaller notional value than the other futures and options.
-
HKEx surveyed Exchange Participants only. Their responses stemmed from their own understanding of their clients. HKEx had no direct access to these clients, nor could it verify their nature.
-
The survey is subject to a number of limitations. For example, an Exchange Participant might not know the true origins of all its client orders. The Exchange Participant might classify transactions for a local institution as such when in fact the orders originated overseas and were placed through that local institution, or vice versa. As a result, the findings may deviate somewhat from the true picture.
Figure 1. Contract volume and percentage of total by product under study
(2006/07 – 2010/11)
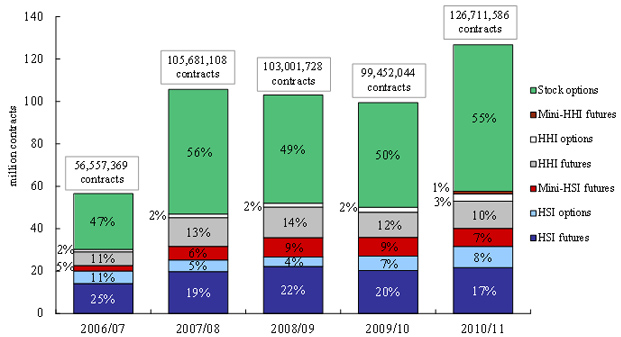
Note: Numbers may not add up to 100 per cent due to rounding.
Figure 2. Distribution of derivatives market trading volume by investor type
(Jul 2010 – Jun 2011)
(a) Overall
(b) Stock options
(c) Futures & options (excluding stock options)
|
Notes:
|
(1) Exchange Participants' principal trading comprises market maker trading and EP proprietary trading.
|
|
(2) Numbers may not add up to 100 per cent due to rounding.
|
Figure 3. Distribution of derivatives market trading volume by investor type
(2001/02 – 2010/11)
(a) Local vs overseas
(b) Retail vs institutional
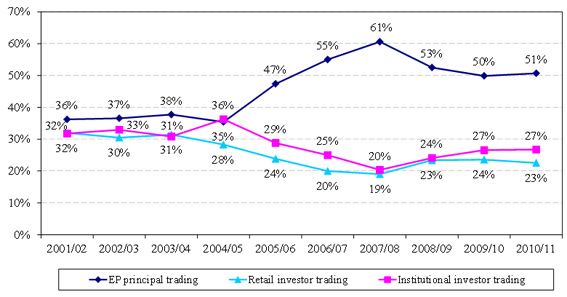
Note: Numbers may not add up to 100 per cent due to rounding.
Figure 4. Distribution of derivatives market trading volume by investor type
for overall market and each product (Jul 2010 – Jun 2011)
|
Notes:
|
(1) Market maker trading and EP proprietary trading are components of EP principal trading.
|
|
(2) Numbers may not add up to 100 per cent due to rounding.
|
Figure 5. Distribution of overseas investor trading volume in derivatives by origin
(Jul 2010 – Jun 2011)
| * |
Reported origins in “Others” in 2010/11 are Africa, Bermuda, British Virgin Islands, Canada, Caribbean, Cayman Islands, Liberia, Middle East, New Zealand and Republic of Seychelles. |
| Note: |
Numbers may not add up to 100 per cent due to rounding. |
Figure 6. Retail online trading to total derivatives market volume
and retail turnover volume (2001/02 – 2010/11)
Ends