The contribution of institutional investors to Hong Kong stock market turnover remained at its highest level since 1991, according to Hong Kong Exchanges and Clearing Limited’s (HKEx) Cash Market Transaction Survey 2007/08 (covering HKEx’s securities market turnover from October 2007 to September 2008).
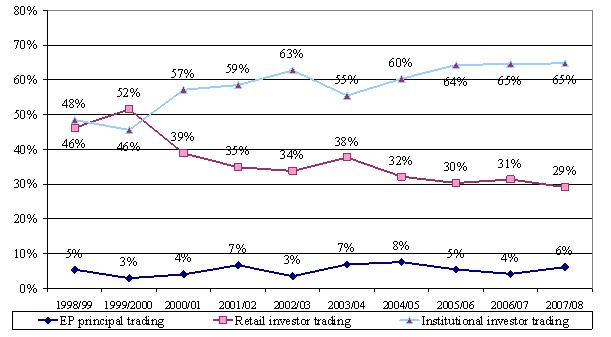
The distribution pattern of market turnover value by investor type –– local retail/institutional investors and overseas retail/institutional investors –– in 2007/08 was little different from that in 2006/07. Institutional investors (both local and overseas) contributed 65 per cent to total market turnover value, similar to the level in 2006/07, which was the highest since the survey started in 1991. The contribution of retail investors declined to 29 per cent in 2007/08, the lowest since the survey started in 1991.
Some other key findings of the 2007/08 survey
-
Overseas institutional investors continued to be the largest contributors among all investor types –– 38 per cent of total market turnover in 2007/08, compared to 39 per cent in 2006/07. (Figure 1)
-
Local retail investors’ contribution to total market turnover decreased somewhat, falling from 28 per cent in 2006/07 to 26 per cent in 2007/08. (Figure 1)
-
Local institutional investors’ contribution increased somewhat, rising from 25 per cent in 2006/07 to 27 per cent in 2007/08. (Figure 1)
-
Stock Exchange Participants’ (EPs) principal trading was 6 per cent of total market turnover in 2007/08, up slightly from 4 per cent in 2006/07. (Figure 1)
-
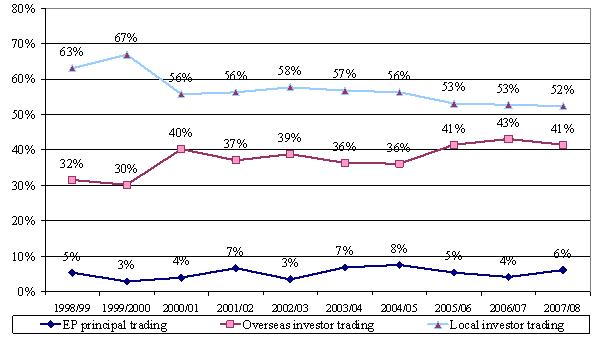
The contribution of all local investors (retail and institutional) to total market turnover was 52 per cent in 2007/08, the lowest since the survey started in 1991. (Figure 2)
-
The contribution of all overseas investors (retail and institutional) to total market turnover was 41 per cent in 2007/08, slightly off its peak in 2006/07. (Figure 2)
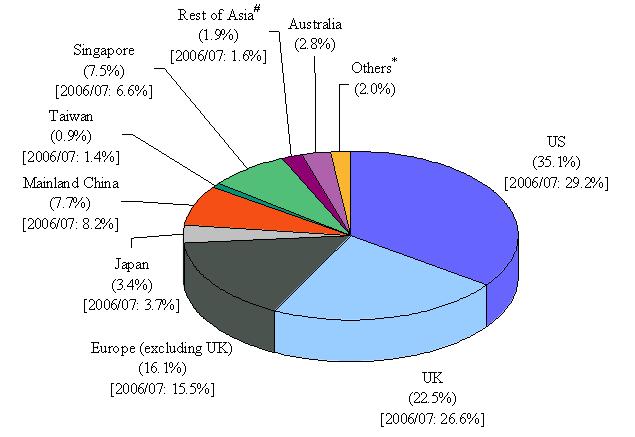
- Trading value by overseas investors by origin (Figure 3):
- US investors were the largest contributor to overseas investor trading in 2007/08, contributing 35 per cent compared to 29 per cent in 2006/07.
- UK investors, the second largest contributors, contributed 22 per cent of overseas investor trading, the lowest level since trading from the UK began to be separately assessed in the 1994/95 survey.
- The contribution of investors from Continental Europe to overseas investor trading was 16 per cent in 2007/08, similar to the level in 2006/07.
- The aggregate contribution from Asian investors to overseas investor trading was 22 per cent in 2007/08, similar to the level in 2006/07.
-
Retail online trading accounted for 17 per cent of total retail investor trading or 5 per cent of total market turnover, similar to the levels in 2006/07. (Figure 4)
The Cash Market Transaction Survey has been conducted annually since 1991. For the 2007/08 survey, questionnaires were sent to a target population of 431 EPs. The response rate was 94 per cent by number and 99 per cent by turnover value of the target respondents.
The full report on the Cash Market Transaction Survey 2007/08 is available on the HKEx website.
|
Notes: |
|
| 1. |
Cash market, securities market and stock market are interchangeable and refer to shares, bonds, funds, derivative warrants and other products traded on The Stock Exchange of Hong Kong Limited, a wholly-owned subsidiary of HKEx. |
| 4. |
The survey’s target respondents were EPs. Their responses stemmed from their own understanding of their clients. HKEx had no direct access to EPs’ clients, nor could it verify their identities. |
| 5. |
One of the limitations of the survey is that EPs might not know the true origins of all their client orders. For instance, an EP might classify transactions for a local institution as such when in fact the orders originated overseas and were placed through that local institution, or vice versa. In some cases, EPs might not be able to identify the composition of orders channelled via banks (which might be regarded as their institutional clients). As a result, the findings may deviate somewhat from the true picture. |
Figure 1. Distribution of cash market trading value by investor type
(Oct 2007 – Sep 2008)
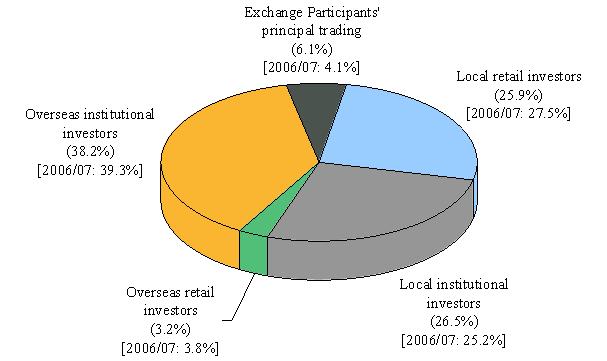
Note: Numbers may not add up to 100 per cent due to rounding.
Figure 2. Distribution of cash market trading value by investor type
(1998/99 – 2007/08)
(a) Local vs overseas
(b) Retail vs institutional
Note: Numbers may not add up to sub-totals or 100 per cent due to rounding.
Figure 3. Distribution of overseas investor trading value in cash market by origin
(Oct 2007 – Sep 2008)
|
Note: |
Numbers may not add up to 100 per cent due to rounding. |
|
Figure 4. Percentage share of retail online trading value in cash market
(1999/2000 – 2007/08)
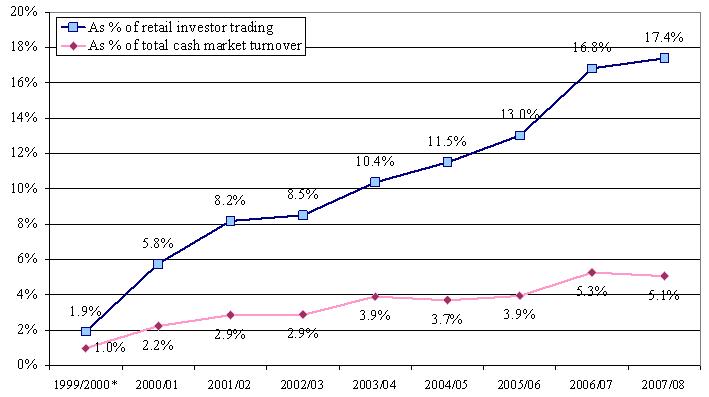
* The term “Internet trading” instead of “online trading” was used in the 1999/2000 survey.