Hong Kong Exchanges and Clearing Limited’s (HKEx) Derivatives Market Transaction Survey 2008/09 (covering the period from July 2008 to June 2009) found that Exchange Participants’ (EPs) principal trading supported half of the trading in HKEx’s derivatives (futures and options) market and the other half had strong support from both local investors (primarily individuals) and overseas investors (primarily institutions).
In 2008/09, the turnover for the futures and options under study was 103 million contracts (referred to as the total market turnover in this survey), compared to 106 million contracts in 2007/08. Stock options remained the dominant product by turnover (as measured by contract volume), albeit with a drop in their contribution to total market turnover (from 56 per cent in 2007/08 to 49 per cent in 2008/09) (see Figure 1).
Some key findings of the 2008/09 survey
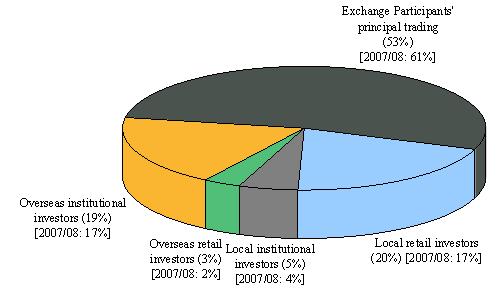
- EP principal trading(comprising market maker trading and EP proprietary trading) contributed 53 per cent of total market turnover (down from 61 per cent in 2007/08), 82 per cent of stock options turnover (vs 89 per cent in 2007/08) and 24 per cent of turnover in other futures and options (vs 26 per cent in 2007/08) (see Figure 2).
|
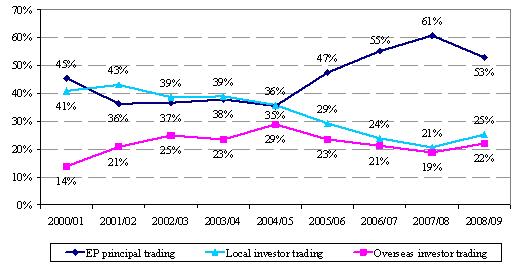
- Local investors contributed 25 per cent of total market turnover (up from 21 per cent in 2007/08), and overseas investors contributed 22 per cent (up from 19 per cent in 2007/08) (see Figure 3).
|
- Retail investors contributed 23 per cent of total market turnover (up from 19 per cent in 2007/08), mostly from local retail investors (20 per cent). Institutional investors contributed 24 per cent in 2008/09 (up from 20 per cent in 2007/08), mostly from overseas institutional investors (19 per cent) (see Figures 2 and 3).
|
- Major products (see Figure 4):
- For Hang Seng Index (HSI) futures, overseas institutional and local retail investors were the major contributors (34 per cent and 32 per cent respectively of the product’s turnover).
- For Mini-HSI futures, the dominant contributors were local retail investors (58 per cent).
- For H-shares Index (HHI) futures, overseas investors were the major contributors (54 per cent: 49 per cent from institutions, 5 per cent from individuals).
- For HHI options, EP principal trading and overseas institutional investors were the major contributors (34 per cent and 28 per cent respectively).
- For stock options and HSI options, EP principal trading was dominant (82 per cent and 51 per cent respectively).
|
- UK investors contributed the most to overseas investor trading in 2008/09 (29 per cent, compared to 32 per cent in 2007/08). US investors came second (19 per cent in 2008/09, down from 26 per cent in 2007/08).Australian investors ranked third (14 per cent in 2008/09, up from 11 per cent in 2007/08). Mainland China, European (excluding the UK) and Singaporean investors were also significant contributors (10-11 per cent in 2008/09) (see Figure 5).
|
The Derivatives Market Transaction Survey has been conducted annually along similar lines since 1994. The surveys for the latest four years covered HSI futures, HSI options, Mini-HSI futures, HHI futures, HHI options and stock options. These products together accounted for 98.9 per cent of the total turnover of the HKEx derivatives market during the study period of the 2008/09 survey. The survey had an overall response rate of 90 per cent and the respondents contributed 99 per cent of the total turnover during the study period.
The full report on the HKEx Derivatives Market Transaction Survey 2008/09 is available on the HKEx website at:http://www.hkex.com.hk/eng/stat/research/documents/dmts09.pdf.
|
Notes :
|
- HKEx surveyed Exchange Participants only. Their responses stemmed from their own understanding of their clients. HKEx had no direct access to these clients, nor could it verify their nature.
|
- One of the limitations of the survey is that Exchange Participants might not know the true origins of all their client orders. For instance, an Exchange Participant might classify transactions for a local institution as such when in fact the orders originated overseas and were placed through that local institution, or vice versa. As a result, the findings may deviate somewhat from the true picture.
|
Figure 1. Contract volume and percentage of total by product under study
(2004/05 – 2008/09)
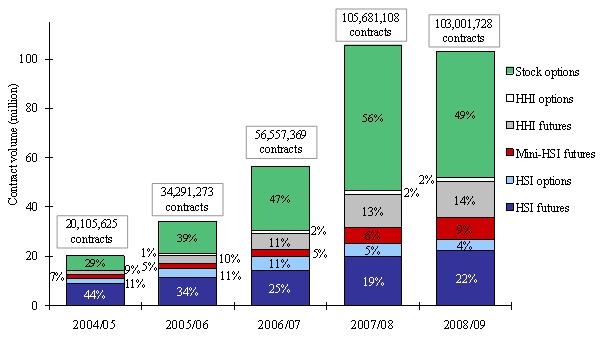
Note: Numbers may not add up to 100 per cent due to rounding.
Figure 2. Distribution of derivatives market trading volume by investor type
(Jul 2008 – Jun 2009)
(a) Overall
(b) Stock options
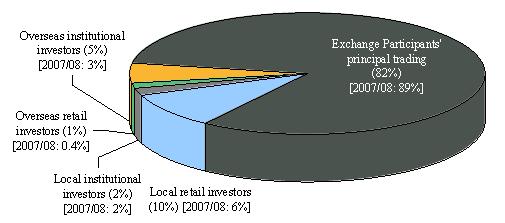
(c) Futures & options (excluding stock options)

Notes: (1) Exchange Participants' principal trading comprised market maker trading and proprietary
trading.
(2) Numbers may not add up to 100 per cent due to rounding.
Figure 3. Distribution of derivatives market trading volume by investor type
(2000/01 – 2008/09)
(a) Local vs overseas
(b) Retail vs institutional
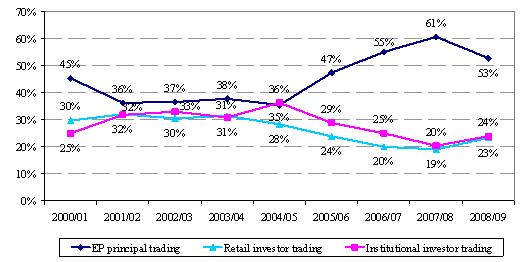
Note: Numbers may not add up to 100 per cent due to rounding.
Figure 4. Distribution of derivatives market trading volume by investor type
for overall market and each product (Jul 2008 – Jun 2009)
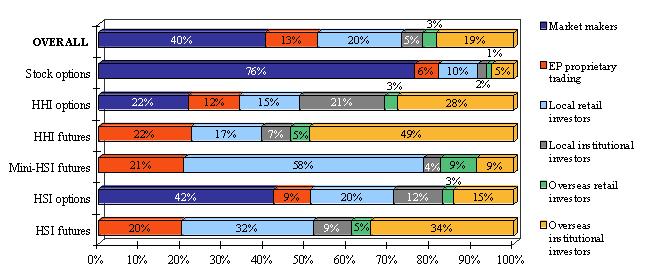
Notes:
(1) Market maker trading and EP proprietary trading are components of EP principal trading.
(2) Numbers may not add up to 100 per cent due to rounding.
Figure 5. Distribution of overseas investor trading in futures and options by origin
(Jul 2008 – Jun 2009)
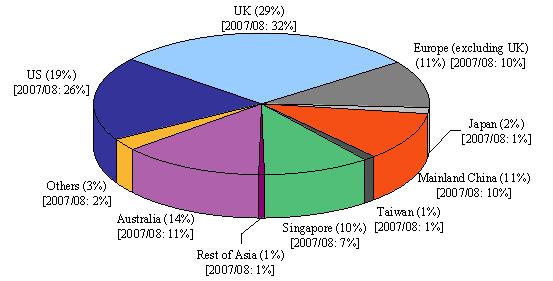
* Reported origins in “Others” in 2008/2009 comprised British Virgin Islands, Canada, Cayman Islands, Liberia, Madagascar, Mauritius, Middle East and New Zealand.
Note: Numbers may not add up to 100 per cent due to rounding.
Figure 6. Retail online trading to total derivatives market volume
and retail turnover volume (2001/02 – 2008/09)
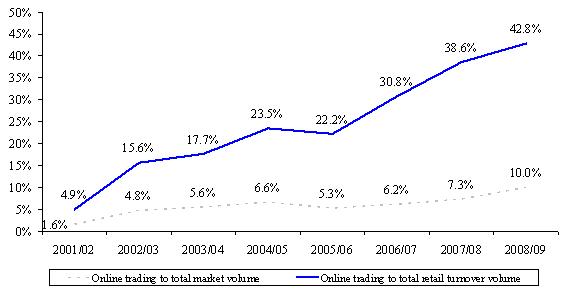
Note: Figures before 2008/09 for the percentage of online trading to total market volume were adjusted to be in line with the 2008/09 survey methodology (under which the percentage is an unweighted figure based on the sample of respondents).