The contribution of overseas investors to Hong Kong stock market turnover has reached a record high, according to Hong Kong Exchanges and Clearing Limited’s (HKEx) Cash Market Transaction Survey 2006/07 (covering HKEx’s securities market from October 2006 to September 2007).
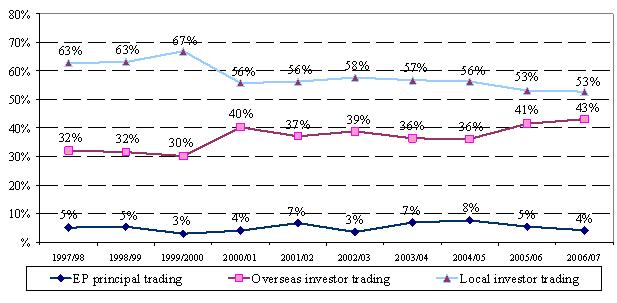
The contribution of overseas investors climbed to 43 per cent of total market turnover in the study period, the highest level since the survey started in 1991. Local investors contributed 53 per cent of turnover, about the same as in 2005/06, while the market share of Stock Exchange Participants’ (EPs) principal trading was 4 per cent, down slightly from the previous survey period. The distribution of market turnover by investor type -- local retail/institutional investors and overseas retail/institutional investors -- was similar to that in 2005/06.
Some other key findings of the 2006/07 survey
-
The contribution from overseas institutional investors remained the largest among all contributor groups -- 39 per cent in 2006/07, an increase for the fourth consecutive year. Overseas retail investor contributed 4 per cent of total market turnover. (Figure 1)
-
The contribution from local retail investors was 28 per cent in 2006/07, similar to 2005/06. Local institutional investors contributed 25 per cent of total market turnover in 2006/07, compared with 26 per cent in 2005/06. (Figure 1)
-
Institutional investors (local and overseas) contributed 65 per cent of the total market turnover in 2006/07, while retail investors (local and overseas) contributed 31 per cent. The contribution of institutional investors was the highest on record. (Figure 2)
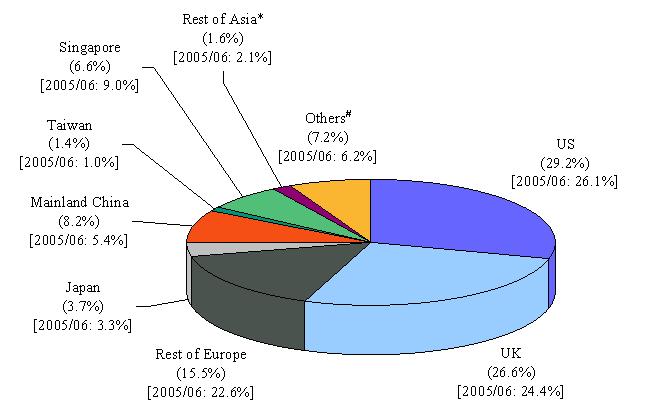
- Trading value by overseas investors by origin (Figure 3):
- US investors were the largest contributor to overseas investor trading in 2006/07 (29 per cent vs 26 per cent in 2005/06). They were followed by UK investors (27 per cent vs 24 per cent in 2005/06).
- The contribution of investors from Continental Europe to overseas investor trading decreased significantly, falling from 23 per cent in 2005/06 to 16 per cent in 2006/07.
- The contribution from Asian investors to overseas investor trading was 22 per cent in 2006/07, compared with 21 per cent in 2005/06.
-
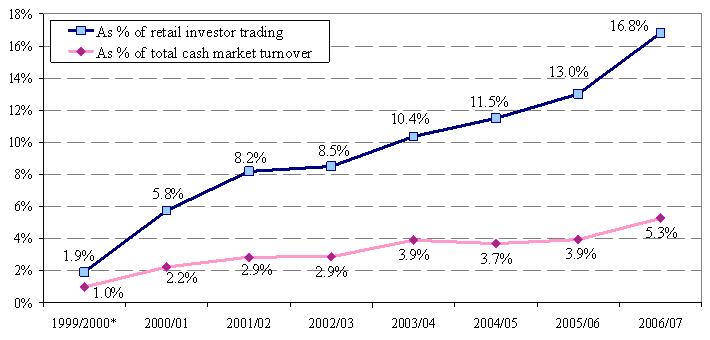
Retail online trading accounted for 17 per cent of total retail investor trading in 2006/07, up from 13 per cent in 2005/06. Its contribution to total market turnover rose to 5 per cent from less than 4 per cent. (Figure 4)
The Cash Market Transaction Survey has been conducted annually since 1991. For the 2006/07 survey, questionnaires were sent to a target population of 416 EPs. The response rate was 91 per cent by number and 97 per cent by turnover value of the target respondents.
The full report on the Cash Market Transaction Survey 2006/07 is available on the HKEx website (http://www.hkex.com.hk/eng/stat/research/cmts/documents/cmts07.pdf).
|
|
| 2. |
Stock Exchange Participant, or EP, principal trading is trading on the EP firm’s own account.
|
|
|
| 3. |
Retail online trading refers to trading originating from orders entered directly by individual/retail investors and channeled to the brokers via electronic media (eg the Internet).
|
|
|
| 4. |
The survey’s target respondents were EPs. Their responses stemmed from their own understanding of their clients. HKEx had no direct access to EPs’ clients, nor could it verify their identities.
|
|
|
| 5. |
One of the limitations of the survey is that EPs might not know the true origins of all their client orders. For instance, an EP might classify transactions for a local institution as such when in fact the orders originated overseas and were placed through that local institution, or vice versa. In some cases, EPs might not be able to identify the composition of orders channeled via banks (which might be regarded as their institutional clients). As a result, the findings may deviate somewhat from the true picture.
|
Figure 1. Distribution of cash market trading value by investor type
(Oct 2006 – Sep 2007)
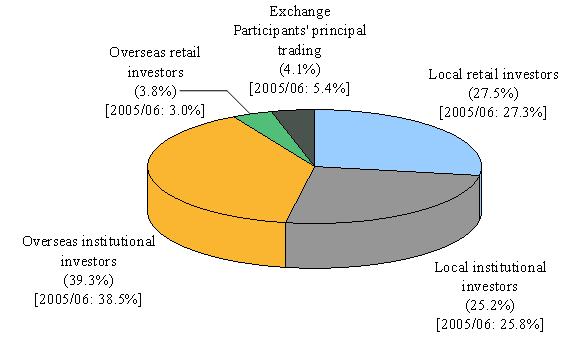
Note: Numbers may not add up to 100 per cent due to rounding.
Figure 2. Distribution of cash market trading value by investor type
(1997/98 – 2006/07)
(a) Local vs overseas
(b) Retail vs institutional
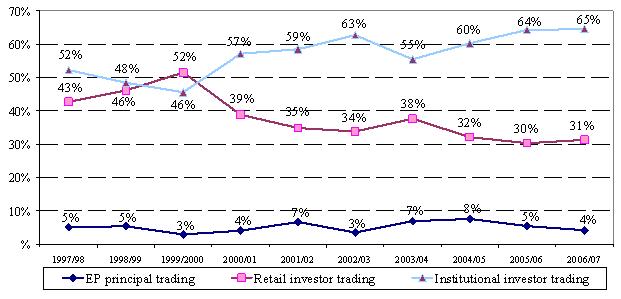
Figure 3. Distribution of overseas investor trading value in cash market by origin
(Oct 2006 – Sep 2007)
| # |
Reported origins in “Others” are Australia, Bahamas, Belgium, Bermuda, Brazil, British Virgin Islands, Canada, Cayman Islands, Cyprus, Dominican Republic, Israel, Kuwait, Mauritius, Mexico, New Zealand, South Africa, Switzerland, Turkey, United Arab Emirates and Venezuela.
|
| Note: |
Numbers may not add up to 100 per cent due to rounding. |
Figure 4. Percentage share of retail online trading value in cash market
(1999/2000 – 2006/07)
* The term “Internet trading” instead of “online trading” was used in the 1999/2000 survey.