Trading by overseas investors attained a compound annual growth rate (CAGR) of 34 per cent in the past decade, strongly supporting overall market growth, according to the Cash Market Transaction Survey 2010/11 released today (6 March 2011) by Hong Kong Exchanges and Clearing Limited (HKEx).
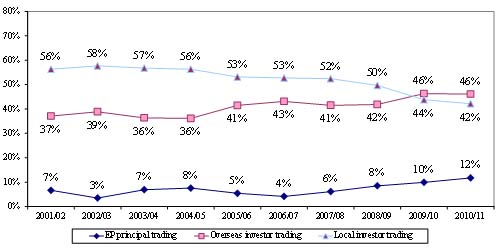
In 2010/11, overseas investors contributed 46 per cent of total market turnover value, similar to 2009/10. Local investors contributed 42 per cent, down from 44 per cent in the previous year. Institutional investors contributed 62 per cent of total market turnover value (64 per cent in 2009/10), remaining above 60 per cent for the sixth consecutive year. The contribution from retail investors was 27 per cent in 2010/11, compared to 26 per cent in the previous year (see Figures 1 and 2).
Some other key findings of the 2010/11 survey
- Overseas institutional investors, the largest contributors among all investor types, contributed 42 per cent of total market turnover, similar to their contribution in 2009/10 (see Figure 1).
- Local institutional investors contributed 20 per cent to total market turnover, down from 23 per cent in 2009/10 (see Figure 1).
- Local retail investors contributed 22 per cent to total market turnover, compared to 21 per cent in 2009/10 (see Figure 1).
- Exchange Participants' principal trading contributed a record high of 12 per cent of total market turnover in 2010/11, up from 10 per cent in 2009/10 (see Figure 1).
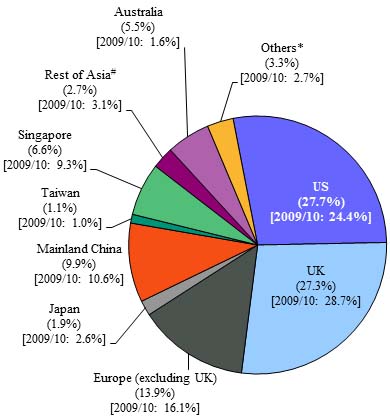
- Findings regarding trading value by overseas investors (see Figure 3) show that:
- US investors regained their status as the largest contributors to overseas investor trading in 2010/11 with a contribution of 28 per cent, up from 24 per cent in 2009/10.
- UK investors, the second largest contributors, contributed 27 per cent of overseas investor trading in 2010/11, compared to 29 per cent in 2009/10.
- Continental European investors were ranked third with a contribution to overseas investor trading of 14 per cent in 2010/11, compared to 16 per cent in 2009/10.
- The contribution of investors from Mainland China to overseas investor trading was 10 per cent in 2010/11, compared to 11 per cent in 2009/10.
- Asian investors in aggregate contributed 22 per cent of overseas investor trading in 2010/11, compared to 27 per cent in 2009/10.
- There were 17 reported origins of overseas investors in Asia and over 36 reported origins of overseas investors outside Asia, Europe and the US.
- The survey examined for the first time the CAGR in trading value by investor type in the past decade. The three overseas origins that had the highest CAGR were Mainland China (47 per cent), US (36 per cent) and UK (34 per cent) (see Table 1).
- Retail online trading accounted for 26 per cent of total retail investor trading (27 per cent in 2009/10) and 7 per cent of total market turnover (similar to that in 2009/10) (see Figure 4).
The Cash Market Transaction Survey has been conducted annually since 1991. Each year’s survey covers HKEx's securities market turnover for the 12-month period from October the previous year to September the following year. For the 2010/11 survey, questionnaires were sent to a target population of 471 Exchange Participants. The response rate was 92 per cent by number and 96 per cent by turnover value of the target respondents.
The full report on the Cash Market Transaction Survey 2010/11 is available on the HKEx website.
Notes:
- Cash market, securities market and stock market are interchangeable and refer to shares, bonds, funds, derivative warrants and other products traded on The Stock Exchange of Hong Kong Limited, a wholly-owned subsidiary of HKEx.
- Stock Exchange Participant, or EP, principal trading is trading on the EP firm's own account.
- Retail online trading refers to trading originating from orders entered directly by individual/retail investors and channelled to brokers via electronic media (eg the Internet).
- The survey' target respondents were EPs. Their responses stemmed from their own understanding of their clients. HKEx had no direct access to EPs' clients, nor could it verify their identities.
- One of the limitations of the survey is that EPs might not know the true origins of all their client orders. For instance, an EP might classify transactions for a local institution as such when in fact the orders originated overseas and were placed through that local institution, or vice versa. In some cases, EPs might not be able to identify the composition of orders channelled via banks (which might be regarded as their institutional clients). As a result, the findings may deviate somewhat from the true picture.
Figure 1. Distribution of cash market trading value by investor type
(Oct 2010 – Sep 2011)
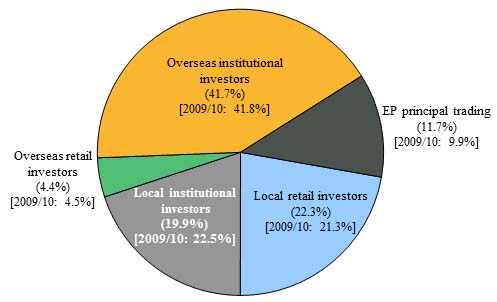
Note: Numbers may not add up to 100 per cent due to rounding.
Figure 2. Distribution of cash market trading value by investor type
(2001/02 – 2010/11)
(a) Local vs overseas
(b) Retail vs institutional
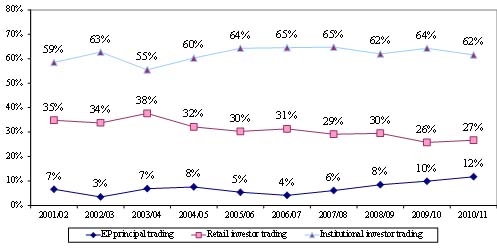
Note: Numbers may not add up to 100 per cent due to rounding.
Figure 3. Distribution of overseas investor trading value in cash market by origin
(Oct 2010 – Sep 2011)
| # |
In 2010/11, reported origins in “Rest of Asia” were Bangladesh, Brunei, Cambodia, India, Indonesia, Kazakhstan, Laos, Macau, Malaysia, Maldives, Mongolia, Myanmar, Pakistan, Philippines, South Korea, Thailand and Vietnam.
|
| * |
In 2010/11, reported origins in “Others” included Algeria, Anguilla, Bahamas, Bahrain, Belize, Bermuda, Brazil, British Virgin Islands, Canada, Cayman Islands, Chile, Colombia, Cyprus, Commonwealth of Dominica, Dutch Antilles, Fiji, Ghana, Guatemala, Island of Nevis, Israel, Kuwait, Liberia, Mauritius, Mexico, Monaco, Nauru, New Zealand, Panama, Russia, Samoa, Saudi Arabia, Seychelles, South Africa, Turkey, United Arab Emirates and Venezuela.
|
Note: Numbers may not add up to 100 per cent due to rounding.