Overseas investor participation in the securities market of Hong Kong Exchanges and Clearing Limited (HKEx) remained high despite the market downturn during the global financial crisis, according to HKEx’s Cash Market Transaction Survey 2008/09 (covering HKEx’s securities market turnover from October 2008 to September 2009).
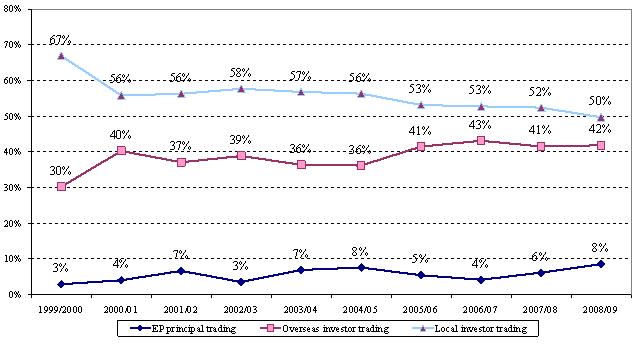
The survey found that the contribution of overseas investors to total market turnover value remained at a relatively high level of more than 40 per cent for the fourth consecutive year (42 per cent in 2008/09, compared to 41 per cent in 2007/08) while local investors’ contribution fell to a record low of 50 per cent. The contribution of institutional investors decreased somewhat from its peak of 65 per cent in 2006/07 and 2007/08 to 62 per cent in 2008/09. The contribution of retail investors was 30 per cent, similar to the all-time low of 29 per cent in 2007/08.
Some other key findings of the 2008/09 survey
|
|
Overseas institutional investors, the largest contributors among all investor types, contributed 38 per cent to total market turnover, similar to the level in 2007/08. (Figure 1)
|
|
|
Local retail investors’ contribution to total market turnover was a record low of 25 per cent in 2008/09, compared to 26 per cent in 2007/08. (Figure 1)
|
|
|
Local institutional investors’ contribution fell from 27 per cent in 2007/08 to 24 per cent in 2008/09. (Figure 1)
|
|
|
Exchange Participants’ principal trading contributed a record high of 8 per cent of total market turnover in 2008/09, up from 6 per cent in 2007/08. (Figure 1)
|
|
|
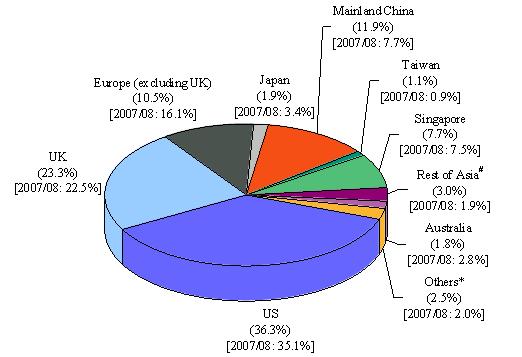
Findings regarding trading value by overseas investors by origin show that (Figure 3):
|
|
- |
US investors, the largest contributors to overseas investor trading since 2004/05, contributed 36 per cent of overseas investor trading in 2008/09, up from 35 per cent in 2007/08.
|
|
- |
UK investors, the second largest contributors, contributed 23 per cent of overseas investor trading, up from 22 per cent in 2007/08.
|
|
- |
The contribution of investors from Continental Europe to overseas investor trading decreased sharply from 16 per cent in 2007/08 to 10 per cent in 2008/09.
|
|
- |
The contribution of investors from Mainland China increased from 8 per cent of overseas investor trading in 2007/08 to 12 per cent in 2008/09 and they became the third largest group of overseas contributors.
|
|
- |
The aggregate contribution from Asian investors to overseas investor trading increased from 22 per cent in 2007/08 to 26 per cent in 2008/09.
|
|
|
Retail online trading accounted for 21 per cent of total retail investor trading and 6 per cent of total market turnover, up from the corresponding levels in 2007/08. (Figure 4)
|
The Cash Market Transaction Survey has been conducted annually since 1991. For the 2008/09 survey, questionnaires were sent to a target population of 440 Exchange Participants. The response rate was 93 per cent by number and 99 per cent by turnover value of the target respondents.
The full report on the Cash Market Transaction Survey 2008/09 is available on the HKEx website.
Notes:
| 1. |
Cash market, securities market and stock market are interchangeable and refer to shares, bonds, funds, derivative warrants and other products traded on The Stock Exchange of Hong Kong Limited, a wholly-owned subsidiary of HKEx.
|
| 2. |
Stock Exchange Participant, or EP, principal trading is trading on the EP firm’s own account.
|
| 3. |
Retail online trading refers to trading originating from orders entered directly by individual/retail investors and channelled to brokers via electronic media (eg the Internet).
|
| 4. |
The survey’s target respondents were EPs. Their responses stemmed from their own understanding of their clients. HKEx had no direct access to EPs’ clients, nor could it verify their identities.
|
| 5. |
One of the limitations of the survey is that EPs might not know the true origins of all their client orders. For instance, an EP might classify transactions for a local institution as such when in fact the orders originated overseas and were placed through that local institution, or vice versa. In some cases, EPs might not be able to identify the composition of orders channelled via banks (which might be regarded as their institutional clients). As a result, the findings may deviate somewhat from the true picture.
|
Figure 1. Distribution of cash market trading value by investor type
(Oct 2008 – Sep 2009)
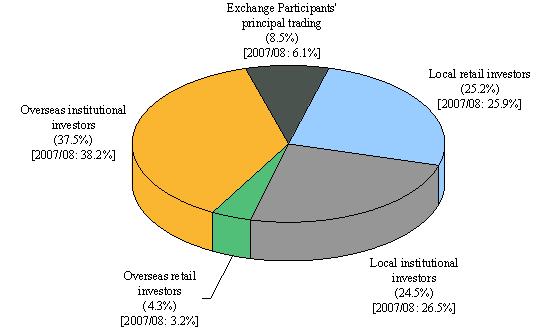
Note: Numbers may not add up to 100 per cent due to rounding.
Figure 2. Distribution of cash market trading value by investor type
(1999/2000 – 2008/09)
(a) Local vs overseas
(b) Retail vs institutional
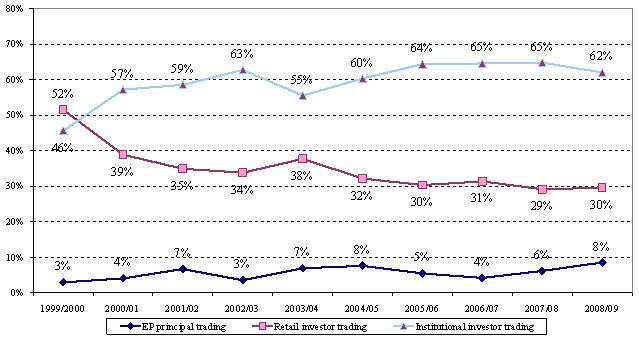
Note: Numbers may not add up to sub-totals or 100 per cent due to rounding.
Figure 3. Distribution of overseas investor trading value in cash market by origin
(Oct 2008 – Sep 2009)
|
#
|
Reported origins in “Rest of Asia” were Bangladesh, Brunei, Cambodia, India, Indonesia, Kazakhstan, Korea, Macau, Malaysia, Nepal, Pakistan, Philippines, Sri Lanka, Thailand and Vietnam.
|
|
*
|
Reported origins in “Others” included Anguilla, Bahamas, Bahrain, Belize, Bermuda, Brazil, British Virgin Islands, Canada, Cayman Islands, Chile, Colombia, Cyprus, Egypt, Ghana, Guatemala, Iraq, Israel, Kuwait, Mauritius, Mexico, Nevis, New Caledonia, New Zealand, Panama, Qatar, Seychelles, Samoa, Saudi Arabia, South Africa, United Arab Emirates and Venezuela.
|
|
Note:
|
Numbers may not add up to 100 per cent due to rounding.
|
Figure 4. Percentage share of retail online trading value in cash market
(1999/2000 – 2008/09)
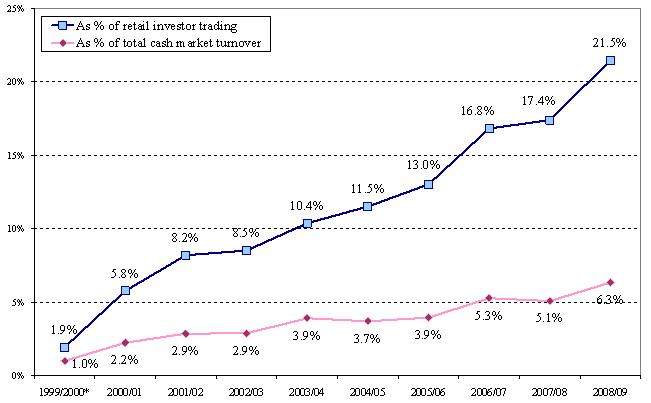
* The term “Internet trading” instead of “online trading” was used in the 1999/2000 survey.