Hong Kong Exchanges and Clearing Limited’s (HKEx) Derivatives Market Transaction Survey 2013/14 (covering July 2013 to June 2014) found that trading of all investor types - local and overseas, retail and institutional - in H-shares index (HHI) products increased in the period.
HHI futures surpassed Hang Seng Index (HSI) futures in turnover for the first time in a survey period, and it was the most actively traded futures contract in HKEx’s derivatives market, which comprises predominantly financial futures and options, in 2013/14. Stock options remained the dominant product by turnover in 2013/14, contributing 48 per cent of the total (there were options for 74 securities at the end of the survey period) (See Figure 1).
The total turnover in 2013/14 for the products under study was 126 million contracts, up 1 per cent from 2012/13. Over the past decade, derivatives market trading had a compound annual growth rate of 23 per cent.
Other key findings of the 2013/14 survey
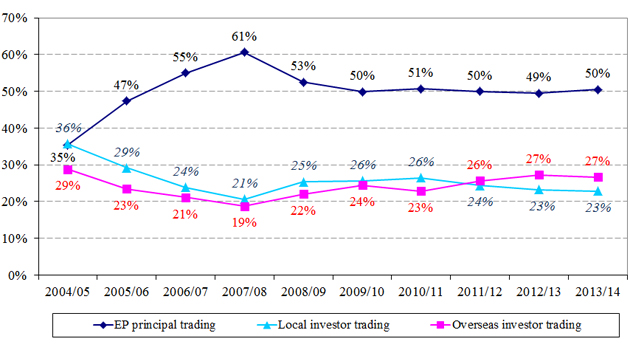
- EP principal trading (comprising market maker trading and proprietary trading by Exchange Participants (EPs)) contributed 50 per cent of total market turnover (compared to 49 per cent in 2012/13), 71 per cent of stock options turnover (compared to 70 per cent in 2012/13) and 31 per cent of turnover in index futures and options (same as 2012/13) (see Figure 2).
- Overseas investors contributed 27 per cent of total market turnover and local investors contributed 23 per cent (same as 2012/13) (see Figure 3).
- Retail investors contributed 19 per cent of total market turnover (compared to 21 per cent in 2012/13), mostly from local retail investors (16 per cent). Institutional investors contributed 30 per cent in 2013/14 (same as 2012/13), most of this (24 per cent) being from overseas institutional investors. (See Figures 2 and 3)
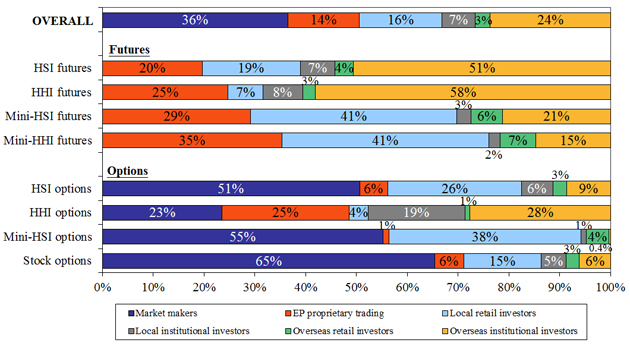
- Major products (see Figure 4):
- For HSI futures, overseas institutional investors were the major contributors (51 per cent of the product's turnover) while EP proprietary trading and local retail investor trading were also significant (20 per cent and 19 per cent respectively).
- For HHI futures, overseas institutional investors were the major contributors (58 per cent). EP proprietary trading was also significant (25 per cent).
- For Mini-HSI futures, the major contributor was local retail investors (41 per cent) with a significant contribution from EP proprietary trading (29 per cent).
- For Mini-HHI futures, local retail investors were the major contributors (41 per cent). EP proprietary trading was also significant (35 per cent).
- For HSI options, EP principal trading was dominant (56 per cent, 51 per cent from market making) while local investors’ contribution was also significant (32 per cent, 26 per cent from individuals).
- For HHI options, the major contributors were EP principal trading (49 per cent, 23 per cent from market making and 25 per cent from proprietary trading) and overseas institutional investors (28 per cent).
- For Mini-HSI options, EP principal trading was dominant (56 per cent, 55 per cent from market making) while local retail investors’ contribution was also significant (38 per cent).
- For stock options, EP principal trading was dominant (71 per cent, 65 per cent from market making) while local investor trading was also significant (20 per cent, 15 per cent from individuals).
- Among overseas investors, Continental European investors were the largest contributors to overseas investor trading (28 per cent). They were followed by UK investors (25 per cent) and US investors (21 per cent). Almost all trading from these origins came from institutional investors (over 93 per cent). The aggregate contribution from investors in Asia outside Hong Kong was 20 per cent of overseas investor trading, mainly from Mainland China and Singapore (9 per cent and 7 per cent respectively) (See Figure 5).
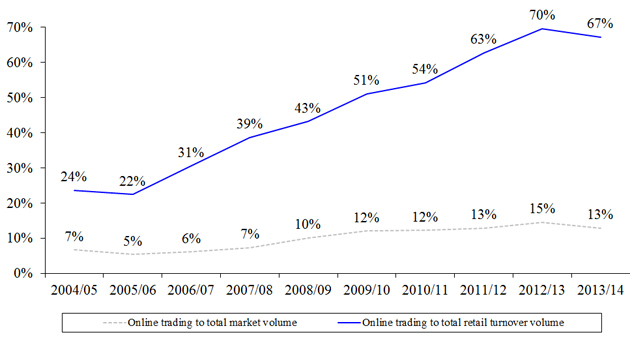
- Retail online trading contributed 67 per cent of total retail investor trading (down from 70 per cent in 2012/13) and 13 per cent of total market turnover (down from 15 per cent in 2012/13) (see Figure 6).
The survey has been conducted annually since 1994. The latest survey covers HSI futures, HSI options, Mini-HSI futures, Mini-HSI options, HHI futures, HHI options, Mini-HHI futures and stock options. These products together accounted for 99 per cent of the total turnover of the HKEx derivatives market during the study period of the 2013/14 survey. The survey had an overall response rate of 93 per cent and the respondents contributed 98 per cent of the total turnover in products under study during the study period.
The full report on the HKEx Derivatives Market Transaction Survey 2013/14 is available on the HKEx website.
Notes:
- "Total market turnover" in the report refers to the total turnover, measured in contracts traded, of the products under study.
- Due to their dominance by contract volume, stock options have a large influence on the trading pattern of the HKEx derivatives market even though they have much smaller notional value than the other futures and options.
- HKEx surveyed Exchange Participants only. Their responses stemmed from their own understanding of their clients. HKEx had no direct access to these clients, nor could it verify their nature.
- The survey is subject to a number of limitations. For example, an Exchange Participant might not know the true origins of all its client orders. The Exchange Participant might classify transactions for a local institution as such when in fact the orders originated overseas and were placed through that local institution, or vice versa. As a result, the findings may deviate somewhat from the true picture.
Figure 1. Contract volume and percentage of total by product under current study
(2009/10 - 2013/14)
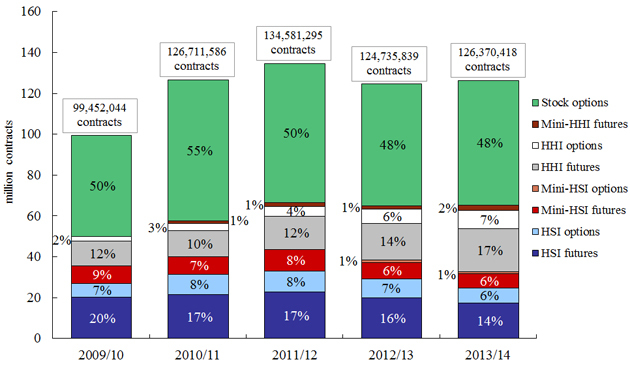
Note: Numbers may not add up to 100 per cent due to rounding.
Figure 2. Distribution of derivatives market trading volume by investor type
(Jul 2013 – Jun 2014)
(a) Overall
(b) Stock options
(c) Index futures & options
| Notes: |
(1)Exchange Participants' principal trading comprised market maker trading and EP proprietary trading.
|
|
(2)Numbers may not add up to 100% due to rounding.
|
Figure 3. Distribution of derivatives market trading volume by investor type
(2004/05 – 2013/14)
(a) Local vs overseas
(b) Retail vs institutional
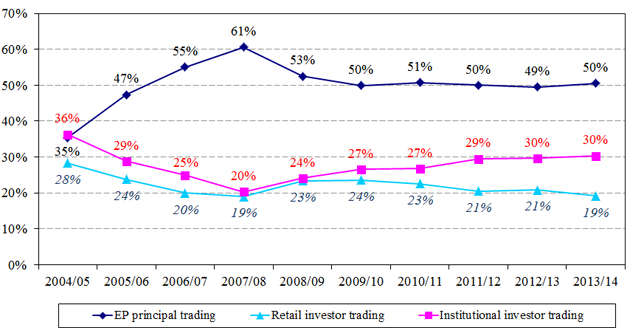
Note: Numbers may not add up to 100 per cent due to rounding.
Figure 4. Distribution of derivatives market trading volume by investor type
for overall market and each product (Jul 2013 – Jun 2014)
| Notes: |
(1) |
Market maker trading and EP proprietary trading are components of EP principal trading.
|
|
(2) |
Numbers may not add up to 100 per cent due to rounding.
|
Figure 5. Distribution of overseas investor trading volume in derivatives by origin
(Jul 2013 – Jun 2014)
| # |
Reported origins in "Rest of Asia" in 2013/14 are India, Indonesia, Macau, Malaysia, Philippines, South Korea and Thailand.
|
| * |
Reported origins in "Others" in 2013/14 are Africa, Bermuda, British Virgin Islands, Canada, Cayman Islands, Cook Islands, Middle East and Samoa.
|
| Note: |
Numbers may not add up to 100 per cent due to rounding.
|
Figure 6. Retail online trading to total derivatives market volume
and retail turnover volume (2004/05 – 2013/14)
Ends