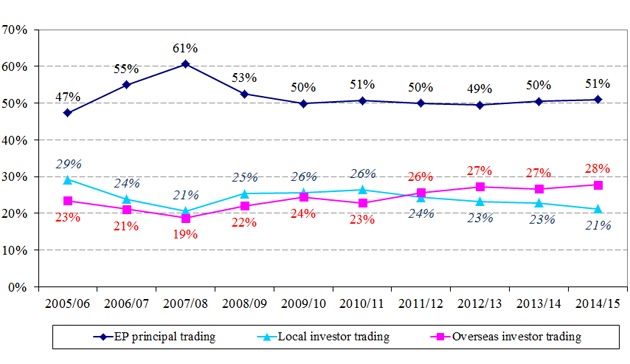
Hong Kong Exchanges and Clearing Limited's (HKEx) Derivatives Market Transaction Survey 2014/15 (covering July 2014 to June 2015) found that derivatives trading by overseas investors (mainly institutions) and Exchange Participants (EPs) had compound annual growth rates (CAGRs) of 22 per cent and 21 per cent respectively in the past decade, strongly supporting overall derivatives market growth and contributing to record volume.
In 2014/15, the total turnover for the products covered by the survey was 175 million contracts (referred to as "total market turnover" in this news release and the survey results), a new high and up 39 per cent from 126 million contracts in 2013/14. Over the past decade, derivatives market trading had a CAGR of 20 per cent. In 2014/15, stock options remained the dominant product by turnover, contributing 55 per cent of the total market turnover (as measured by contract volume). (See Figure 1.)
Other key findings of the 2014/15 survey
- EP principal trading (comprising market maker trading and proprietary trading by EPs) contributed 51 per cent of total market turnover (compared to 50 per cent in 2013/14), 71 per cent of stock options turnover (same as 2013/14) and 27 per cent of turnover in index futures and options (down from 31 per cent in 2013/14) (see Figure 2).
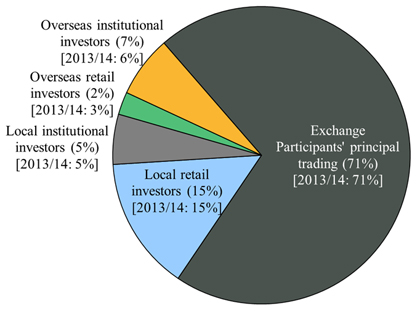
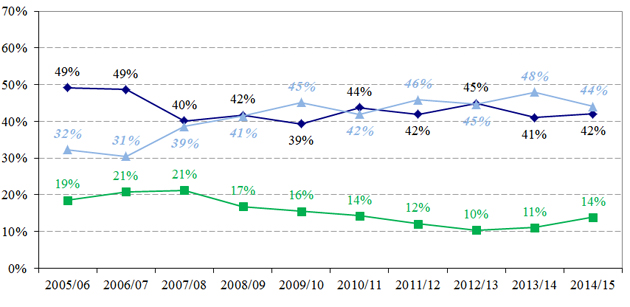
- Overseas investors contributed 28 per cent of total market turnover and local investors contributed 21 per cent (compared to 27 per cent and 23 per cent respectively in 2013/14) (see Figure 3).
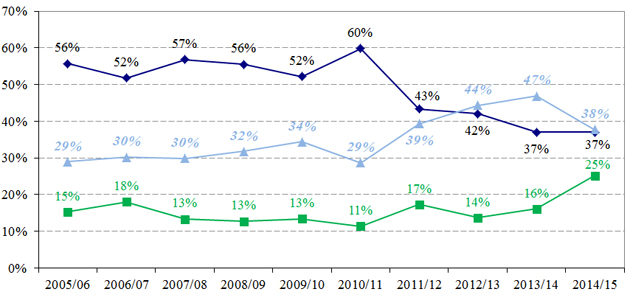
- Retail investors contributed 18 per cent of total market turnover (compared to 19 per cent in 2013/14). They were led by local retail investors (15 per cent). Institutional investors contributed 31 per cent (compared to 30 per cent in 2013/14). Much of it came from overseas institutional investors (25 per cent). (See Figures 2 and 3.)
- Major products (see Figure 4):
- Among overseas investors, US investors were the largest contributors to overseas investor trading (32 per cent). They were followed by UK investors (26 per cent) and Continental European investors (21 per cent). Almost all trading from these origins came from institutional investors (over 90 per cent). The aggregate contribution from investors in Asia outside Hong Kong was 17 per cent of overseas investor trading, mainly from Mainland China and Singapore (10 per cent and 4 per cent respectively) (see Figure 5).
- Hedging and pure trading were the two main transaction purposes for the overall market (44 per cent and 42 per cent respectively). Trading for arbitrage reached its highest proportion for index futures (25 per cent) (see Figure 6).
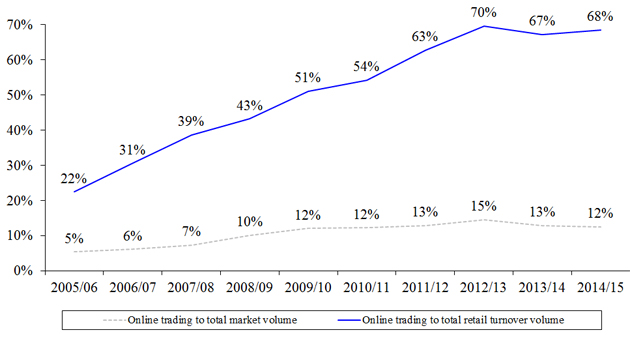
- Retail online trading contributed 68 per cent of total retail investor trading (compared to 67 per cent in 2013/14) and 12 per cent of total market turnover (compared to 13 per cent in 2013/14) (see Figure 7).
The survey has been conducted annually since 1994. The latest survey covers HSI futures, HSI options, Mini-HSI futures, Mini-HSI options, HHI futures, HHI options, Mini-HHI futures and stock options. These products together accounted for 99 per cent of the total turnover of the HKEx derivatives market during the period covered by the 2014/15 survey. The survey had an overall response rate of 89 per cent and the respondents contributed 98 per cent of the total turnover for the products in the survey during the survey period.
The full report on the HKEx Derivatives Market Transaction Survey 2014/15 is available on the HKEx website.
Notes:
- "Total market turnover" in the report refers to the total turnover, measured in contracts traded, of the products in the survey.
- Due to their dominance by contract volume, stock options have a large influence on the trading pattern of the HKEx derivatives market even though they have much smaller notional value than the other futures and options.
- HKEx surveyed Exchange Participants only. Their responses stemmed from their own understanding of their clients. HKEx had no direct access to these clients, nor could it verify their nature.
- The survey is subject to a number of limitations. For example, an Exchange Participant might not know the true origins of all its client orders. As a result, the Exchange Participant might classify a transaction resulted from an order placed by a local institution under that category when in fact the order originated overseas and was placed through that local institution. Therefore, the findings may deviate somewhat from the true picture.
Figure 1. Contract volume and percentage of total by product under study
(2010/11 – 2014/15)
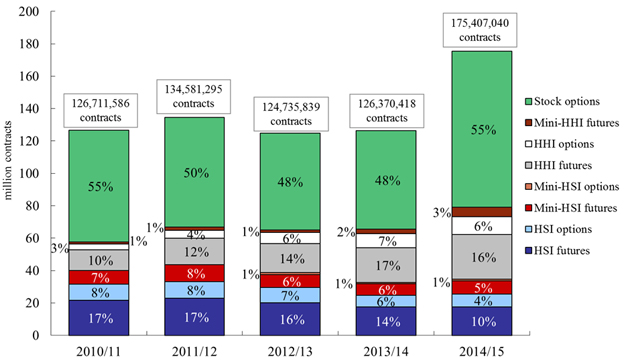
Note: Numbers may not add up to 100 per cent due to rounding.
Figure 2. Distribution of derivatives market trading volume by investor type
(Jul 2014 – Jun 2015)
(a) Overall
(b) Stock options
(c) Index futures & options
| Notes: |
(1) Exchange Participants' principal trading comprised market maker trading and EP proprietary trading.
|
|
(2) Numbers may not add up to 100% due to rounding.
|
Figure 3. Distribution of derivatives market trading volume by investor type
(2005/06 – 2014/15)
(a) Local vs overseas
(b) Retail vs institutional
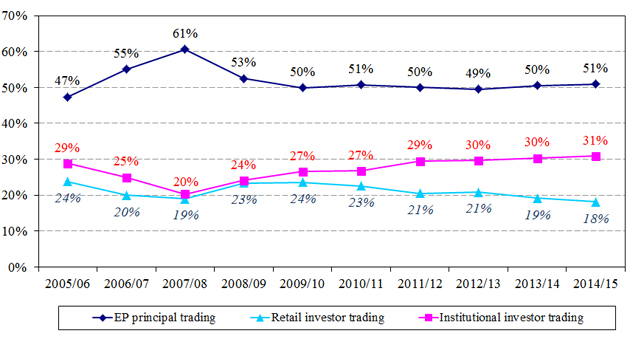
Note: Numbers may not add up to 100 per cent due to rounding.
Figure 4. Distribution of derivatives market trading volume by investor type
for overall market and each product (Jul 2014 – Jun 2015)
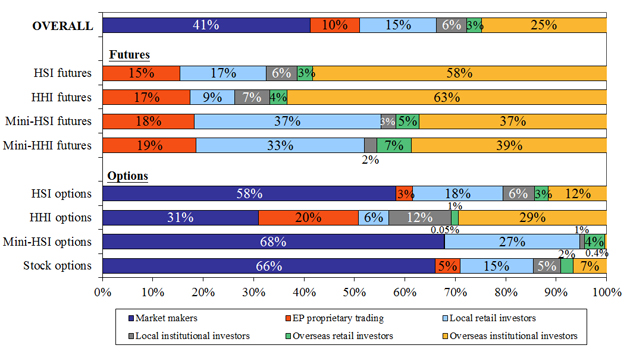
| Notes: |
(1) |
Market maker trading and EP proprietary trading are components of EP principal trading.
|
|
(2) |
Numbers may not add up to 100 per cent due to rounding.
|
Figure 5. Distribution of overseas investor trading volume in derivatives by origin
(Jul 2014 – Jun 2015)
| # |
Reported origins in "Rest of Asia" in 2014/15 are India, Indonesia, Macau, Malaysia, Philippines, South Korea, Thailand and Vietnam.
|
| * |
Reported origins in "Others" in 2014/15 are Anguilla, Bahamas, Belize, Bermuda, British Virgin Islands, Canada, Cayman Islands, Israel, New Zealand, Samoa, Senegal and Seychelles.
|
| Note: |
Numbers may not add up to 100 per cent due to rounding.
|
Figure 6. Distribution of derivatives market trading volume by transaction purpose
(2005/06 – 2014/15)
(a) Overall market
(b) All futures products
(c) All options products
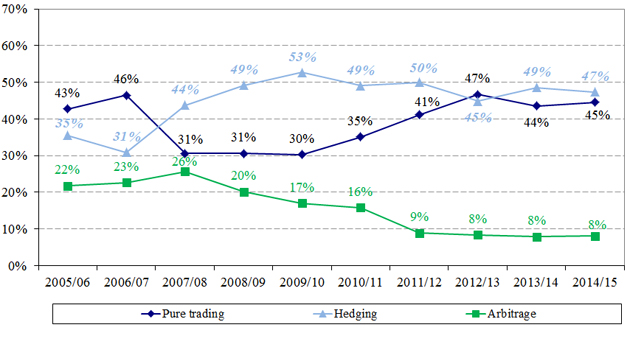
Note: Numbers may not add up to 100 per cent due to rounding.
Figure 7. Retail online trading to total derivatives market volume
and retail turnover volume (2005/06 – 2014/15)
Ends