Hong Kong Exchanges and Clearing Limited (HKEx)’s Derivatives Market Transaction Survey 2007/08 (covering the period from July 2007 to June 2008) found that, driven by the increased dominance of stock options trading, the contribution of Exchange Participants’ (EPs’) principal trading to HKEx’s derivatives (futures and options) market further increased, and retail investors’ online trading grew strongly and accounted for nearly 40 per cent of all retail investor trading.
In 2007/08, derivatives market turnover increased by 87 per cent from 2006/07 to 105.7 million contracts. Of this, 56 per cent was trading in stock options, up from 47 per cent in 2006/07. By contract volume, stock options grew by 123 per cent from 26.3 million contracts in 2006/07 to 58.8 million contracts in 2007/08 (see Figure 1).
Some key findings of the 2007/08 survey
|
|
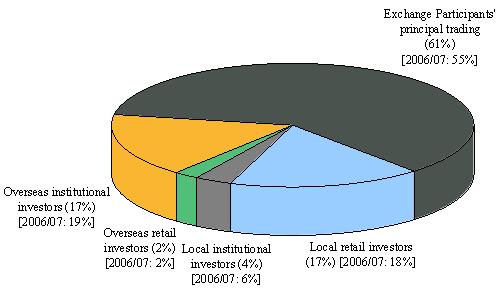
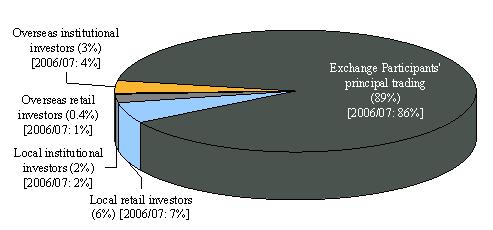
EP principal trading (comprising market maker trading and EP proprietary trading) contributed 61 per cent of total market turnover (55 per cent in 2006/07), 89 per cent of stock options turnover (86 per cent in 2006/07) and 26 per cent of turnover in other derivatives (28 per cent in 2006/07) (see Figure 2).
|
|
|
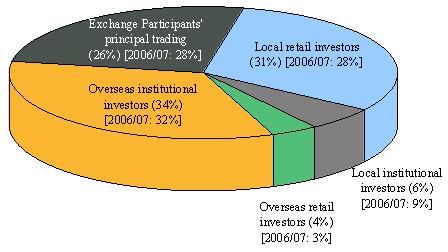
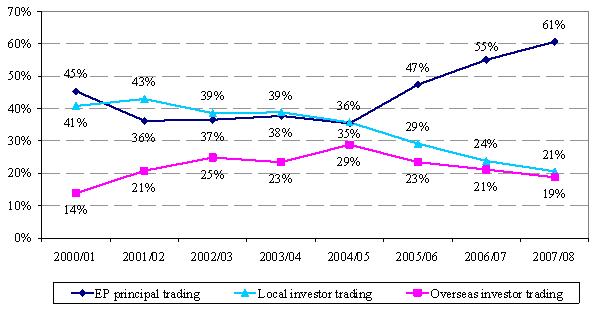
Local investors contributed 21 per cent of total market turnover (24 per cent in 2006/07), and overseas investors contributed 19 per cent (21 per cent in 2006/07) (see Figure 3).
|
|
|
Retail investors contributed 19 per cent of total market turnover (17 per cent from local investors, 2 per cent from overseas investors) and institutional investors contributed 20 per cent (around 4 per cent from local institutional investors and 17 per cent from overseas institutional investors) (see Figures 2 and 3).
|
|
|
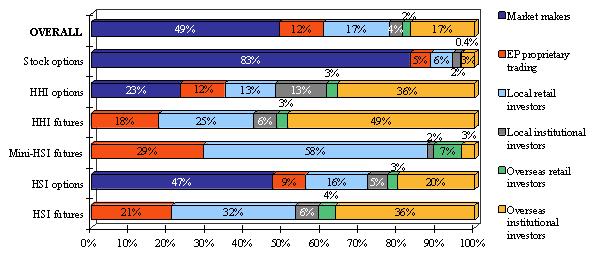
For each major product (see Figure 4): |
|
- |
For Hang Seng Index (HSI) futures, overseas institutional and local retail investors were the major contributors (36 per cent and 32 per cent respectively of the product volume).
|
|
- |
For Mini-HSI futures, the dominant contributors were local retail investors (58 per cent).
|
|
- |
For H-shares Index (HHI) futures, overseas investors were the major contributors (52 per cent: 49 per cent from institutions, 3 per cent from individuals).
|
|
- |
For HHI options, overseas institutional investors and EP principal trading were the major contributors (36 per cent and 35 per cent respectively).
|
|
- |
For stock options and HSI options, EP principal trading was dominant (89 per cent and 56 per cent respectively).
|
|
|
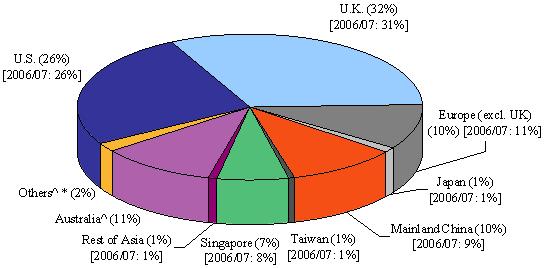
UK investors contributed the most to overseas investor trading in 2007/08 (32 per cent, compared to 31 per cent in 2006/07). US investors came second (26 per cent in both 2006/07 and 2007/08).The contributions from Australian and European (excluding the UK) investors were also significant (11 per cent and 10 per cent respectively in 2007/08) (see Figure 5).
|
|
|
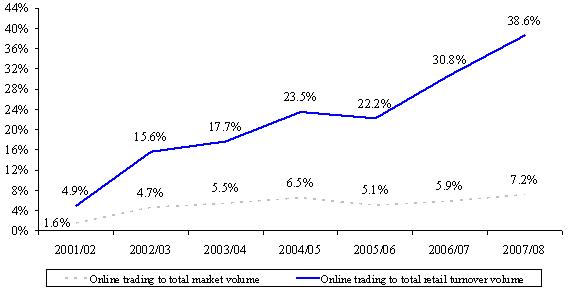
Retail online trading contributed 39 per cent of total retail investor trading (31 per cent in 2006/07) and 7 per cent to total market turnover (6 per cent in 2006/07) (see Figure 6).
|
The Derivatives Market Transaction Survey has been conducted annually along similar lines since 1994. This year’s survey covered HSI futures, HSI options, Mini-HSI futures, HHI futures, HHI options and stock options, which together accounted for about 99.6 per cent of the total turnover of the HKEx derivatives market during the study period. The survey had an overall response rate of 95 per cent and the respondents contributed 98 per cent of the total turnover during the study period.
The full report on the HKEx Derivatives Market Transaction Survey 2007/08 is available on the HKEx website.
Notes :
|
|
One of the limitations of the survey is that Exchange Participants might not know the true origins of all their client orders. For instance, an Exchange Participant might classify transactions for a local institution as such when in fact the orders originated from overseas and were placed through that local institution, or vice versa. As a result, the findings may deviate somewhat from the true picture.
|
Figure 1. Contract volume and percentage of total by product under study
(2003/04 – 2007/08)
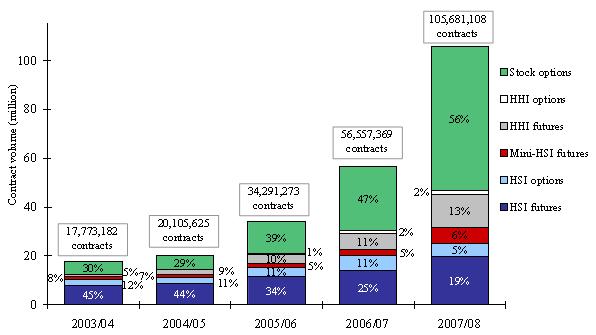
Note: Numbers may not add up to 100% due to rounding.
Figure 2. Distribution of derivatives market trading volume by investor type
(Jul 2007 – Jun 2008)
(a) Overall
(b) Stock options
(c) Futures & options (excluding stock options)
|
(2)
|
Numbers may not add up to 100 per cent due to rounding.
|
Figure 3. Distribution of derivatives market trading volume by investor type
(2000/01 – 2007/08)
(a) Local vs overseas
(b) Retail vs institutional
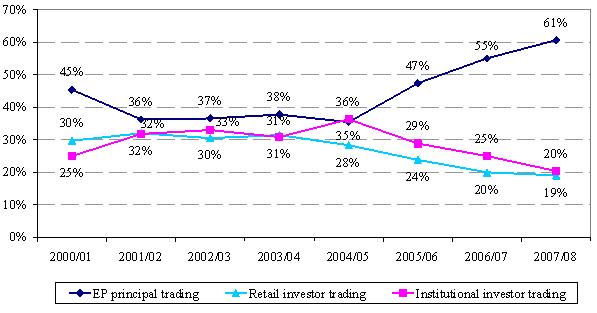
Note: Numbers may not add up to 100% due to rounding.
Figure 4. Distribution of derivatives market trading volume by investor type
for overall market and each product (Jul 2007 – Jun 2008)
|
(2)
|
Numbers may not add up to 100 per cent due to rounding.
|
Figure 5. Distribution of overseas investor trading volume in derivatives by origin
(Jul 2007 – Jun 2008)
|
^ |
Australia was included in “Others” in 2006/07. “Others” including Australia contributed 13% of overseas investor trading volume in 2006/07.
|
Figure 6. Retail online trading to total retail turnover volume
and to total derivatives market volume (2001/02 – 2007/08)