Retail participation in the Hong Kong stock market has reached a new high, according to the Retail Investor Survey 2011 conducted by Hong Kong Exchanges and Clearing Limited (HKEx). The survey, which was conducted during the period from 14 November to 23 December 20111, found that about 2.15 million Hong Kong adults are stock investors, ie individuals who invested in products on the HKEx securities market, which is a new high. This represents 35.7 per cent of the Hong Kong adult population, higher than the 35.0 per cent in 2009 and similar to the participation level in 2007. The survey found that 35.8 per cent of Hong Kong adults are retail investors, ie individuals who participate in the HKEx securities or derivatives (ie futures and options) markets or both. The usage of online stock trading continued to grow and banks remained the major stock trading channel, the survey findings showed.
Key findings of the survey include:
| (1) |
35.7 per cent of Hong Kong adults (or 2,147,000 individuals) were stock investors (individuals who at the time of the interview were holding stocks, or had traded them in the 12-month period preceding the interview).
|
| (2) |
33.8 per cent of Hong Kong adults were stockowners who were holding stocks at the time of the interview. The median stockholding value among all stock investors (including non-stockowners) was $130,000. The median number and value of listed company shareholdings among all stock investors (including non-shareowners) was four and $100,000, respectively.
|
| (3) |
About 7 per cent of stock investors invested in warrants2 (ie were holding warrants at the time of the interview or had traded them in the 12-month period preceding the interview) and 6 per cent invested in Callable Bull/Bear Contracts (CBBCs) (ie were holding CBBCs at the time of the interview or had traded them in the 12-month period preceding the interview). Collectively about 10 per cent of stock investors invested in warrants and/or CBBCs (referred to as warrant/CBBC investors).
|
| (4) |
About 2 per cent of Hong Kong adults (or 122,000 individuals) were derivatives investors (individuals who at the time of the interview were holding futures or options traded on the HKEx derivatives market or had traded them in the 12-month period preceding the interview).3
|
| (5) |
Among stock investors, 82 per cent were stock traders (ie had traded stocks in the 12-month period preceding the interview).
|
| (6) |
68.7 per cent of stock traders were online stock traders who had traded stocks via online media during the 12-month period (up from 66.9 per cent in 2009) while 67.2 per cent of derivatives investors were online derivatives traders who had traded derivatives via online media during the 12-month period (compared to 69.1 per cent in 2009).
|
| (7) |
74.0 per cent of stock traders had traded solely through banks (up from 69.8 per cent in 2009) and 17.9 per cent solely through broker firms (down from 19.3 per cent in 2009). 58.7 per cent of derivatives traders had traded solely through broker firms (up from 44.2 per cent in 2009) and 33.7 per cent solely through banks (down from 47.9 per cent in 2009). |
The typical Hong Kong retail stock investor during the survey period was 47 years old, with matriculation or above education, a monthly personal income of about $16,250 and a monthly household income of about $35,000. The typical Hong Kong retail derivatives investor was 40 years old, with tertiary or above education, a monthly personal income of about $22,500 and a monthly household income of about $45,000.
In median terms, stock investors traded less frequently in 2011 but with a slightly larger deal size than in 2009. The median number of stock transactions of all stock investors (including non-trading stock investors) in the 12-month period was six (compared to 10 in 2009) and the median average value per stock transaction among stock traders was $40,000 (up from $35,000 in 2009). The median implied total stock transaction value per stock trader in the 12-month period was $400,0004, compared to $468,000 in 2009.
For the first time, the 2011 survey asked about trading activity in warrants and CBBCs by stock investors. The median number of warrant/CBBC transactions by warrant/CBBC investors in the 12-month period was 10 while the median average transaction value per transaction was $20,000.
In median terms, derivatives investors traded more frequently in 2011 than in 2009 — the median number of derivatives transactions in the 12-month period was 12 (up from 10 in 2009). The average contract volume per derivatives transaction had a median of two (the same as in 2009). The median implied total contract volume per derivatives investor in the 12-month period was 40, up from 25 in 2009.5
Compared with non-online stock traders, online stock traders tended to be younger, with higher education level and higher work status. They also tended to have traded more frequently.
Stock traders who traded mainly through broker firms tended to have a similar trading pattern as those who traded mainly through banks — a median number of stock transactions of 10 and a median average value per stock transaction of $40,000.
Stock investors were generally positive about most aspects of the Hong Kong stock market assessed in the survey (each with a mean score above four on a 7-point scale with one being strongly disagree and seven being strongly agree). Derivatives investors were also generally positive about the various aspects of HKEx’s derivatives market (all aspects had mean scores above 4.6). Retail investors were also positive when asked whether “HKEx gives priority to the public interest” (a mean score of 4.47).
The Retail Investor Survey has been conducted periodically since 1989. In the Retail Investor Survey 2011, 2,303 individuals were interviewed by telephone.
The full report on the Retail Investor Survey 2011 and reports on past surveys are available on the HKEx website.
Attached are selected findings of the survey presented in tables and charts.
| 1 |
The terms “Dec 2011” or “2011” are used in text, tables and charts for easy reference only. |
| 2 |
Warrants include equity warrants and derivative warrants. |
| 3 |
It should be noted that the statistics on derivatives investors are subject to relatively large error due to the small size of the sample of derivatives investors. |
| 4 |
Please refer to the survey report for the detailed calculation method. |
| 5 |
Please refer to the survey report for the detailed calculation method. |
Notes:
- Stocks: Products listed or traded on the HKEx securities market – including shares, warrants, Exchange Traded Funds (ETFs), Callable Bull/Bear Contracts (CBBCs), Real Estate Investment Trusts (REITs) and other securities.
- Stockowners: Individuals who were, at the time of the interview, holding stocks.
- Stockholding: Holding any HKEx securities market product at the time of the interview.
- Stock investors: Individuals who were, at the time of the interview, holding stocks listed or traded on the HKEx securities market, or had traded them in the 12-month period preceding the interview.
- Shareowners: Individuals who were, at the time of the interview, holding equities (ie shares of listed companies) listed or traded on HKEx.
- Listed company shareholding: Holding listed company shares listed or traded on HKEx at the time of the interview.
- Stock traders: Individuals who had traded stocks listed or traded on the HKEx securities market in the 12-month period preceding the interview.
- Derivatives investors: Individuals who were, at the time of the interview, holding futures or options traded on the HKEx derivatives market, or had traded them in the 12-month period preceding the interview.
- The definition of online stock traders was different in minor respects in surveys before 2002. Such amendments are expected to have little material impact on the comparability of the findings.
- Findings on derivatives investors are subject to relatively large error due to the small size of the sample for them in the survey. Therefore, caution is needed in interpreting the findings on this investor type.
- The survey assesses retail investors’ perceptions of certain aspects of the securities and derivatives markets operated by HKEx. Areas of assessment include those which would largely be outside the responsibility of HKEx, such as the regulation of brokers and the regulation of insider trading.
- “Stock market” and “securities market” are interchangeable and refer to shares, bonds, funds, warrants, CBBCs and other products traded on The Stock Exchange of Hong Kong Limited, a wholly-owned subsidiary of HKEx.
Figure 1. Trend of stockowners and stock investors
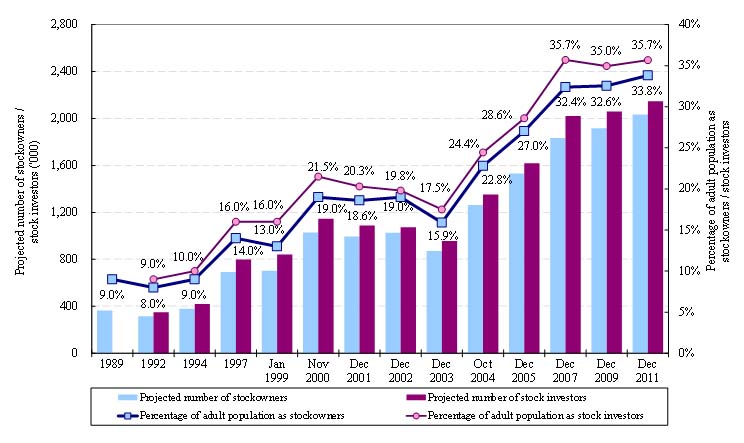
Figure 2. Trend of derivatives investors
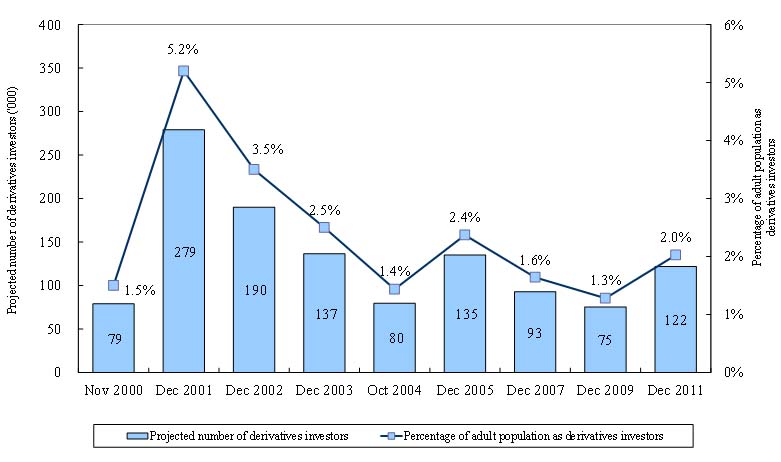
| Note: |
The figures on derivatives investors presented in this chart were subject to relatively large error due to the small size of the sample of derivatives investors in the surveys. |