Hong Kong Exchanges and Clearing Limited (HKEx) released today (Monday) the findings from its Cash Market Transaction Survey 2011/12, revealing the continued diversity among investors in its securities market.
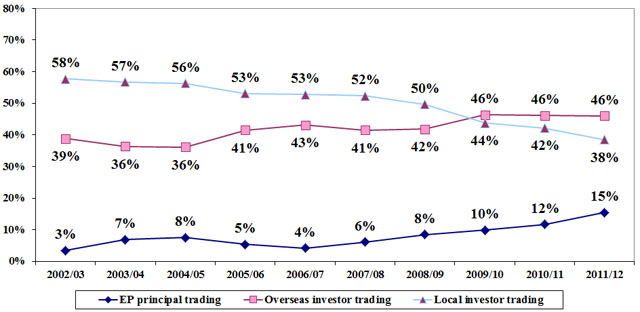
In 2011/12, overseas investors contributed 46 per cent of total market turnover value, similar to 2010/11. Local investors contributed 38 per cent, down from 42 per cent in 2010/11. Institutional investors contributed 63 per cent of total market turnover value (62 per cent in 2010/11). The contribution from retail investors was 21 per cent in 2011/12, down from 27 per cent in 2010/11 (see Figures 1 and 2).
Key findings of the 2011/12 survey
The Cash Market Transaction Survey has been conducted annually since 1991. Each year's survey covers HKEx's securities market turnover for the 12-month period from October the previous year to September the following year. For the 2011/12 survey, questionnaires were sent to a target population of 484 Exchange Participants. The response rate was 94 per cent by number and 98 per cent by turnover value of the target respondents.
The full report on the HKEx Cash Market Transaction Survey 2011/12 is available on the HKEx website.
Notes:
- Cash market, securities market and stock market are interchangeable and refer to shares, bonds, funds, derivative warrants and other products traded on The Stock Exchange of Hong Kong Limited, a wholly-owned subsidiary of HKEx.
- Stock Exchange Participant, or EP, principal trading is trading on the EP firm’s own account.
- Retail online trading refers to trading originating from orders entered directly by individual/retail investors and channelled to brokers via electronic media (eg the Internet).
- The survey's target respondents were EPs. Their responses stemmed from their own understanding of their clients. HKEx had no direct access to EPs’ clients, nor could it verify their identities.
- One of the limitations of the survey is that EPs might not know the true origins of all their client orders. For instance, an EP might classify transactions for a local institution as such when in fact the orders originated overseas and were placed through that local institution, or vice versa. In some cases, EPs might not be able to identify the composition of orders channelled via banks and might regard them as institutional client orders directly from the banks. As a result, the findings may deviate somewhat from the true picture.
Figure 1. Distribution of cash market trading value by investor type
(Oct 2011 – Sep 2012)
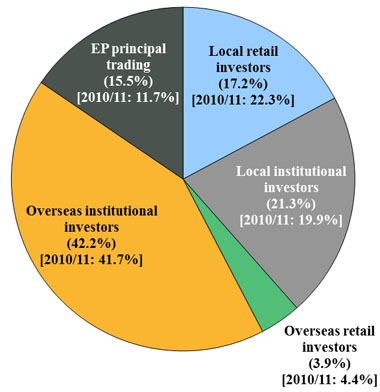
Note: Numbers may not add up to 100 per cent due to rounding.
Figure 2. Distribution of cash market trading value by investor type
(2002/03 – 2011/12)
(a) Local vs overseas
(b) Retail vs institutional
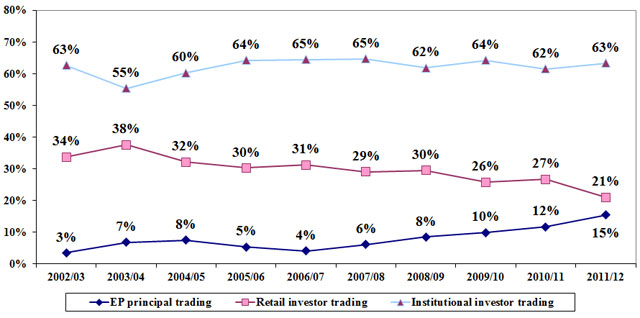
Note: Numbers may not add up to 100 per cent due to rounding.
Figure 3. Distribution of overseas investor trading value in cash market by origin
(Oct 2011 – Sep 2012)
| # |
In 2011/12, reported origins in “Rest of Asia” were Bangladesh, Brunei, Cambodia, India, Indonesia, Kazakhstan, Macau, Malaysia, Mongolia, Myanmar, Pakistan, Philippines, South Korea, Sri Lanka, Thailand and Vietnam. |
| * |
In 2011/12, reported origins in “Others” included Algeria, Anguilla, Bahamas, Bahrain, Belize, Bermuda, Brazil, British Virgin Islands, Canada, Cayman Islands, Channel Islands, Chile, Colombia, Côte d'Ivoire, Cyprus, Dutch Antilles, Grenada, Israel, Kenya, Kuwait, Liberia, Mauritius, Mexico, New Zealand, Oman, Panama, Russia, Samoa, Saudi Arabia, Seychelles, South Africa, Turkey, United Arab Emirates, Uruguay and Venezuela. |
| Note: |
Numbers may not add up to 100 per cent due to rounding. |