A survey conducted by Hong Kong Exchanges and Clearing Limited (HKEx) during the period from 13 November to
23 December 20091 revealed that
retail participation in the HKEx stock market remains high. Over one-third of the
Hong Kong
adult population are stock investors, ie individuals who invest in products on the HKEx securities (or stock) market. According to the survey, 35.1 per cent of the
Hong Kong
adults were retail investors, ie individuals who participate in the HKEx stock market or derivatives (ie futures and options) market or both, compared to 35.8 per cent in 2007.
The Retail Investor Survey 2009 revealed that:
-
35.0 per cent
of
Hong Kong
adults
(or 2,059,000 individuals) were stock investors (individuals who
at
the time of interview were holding stocks, or had traded them in the 12-month period preceding the interview).
-
32.6 per cent of Hong Kong adults were stockowners
who were holding stocks at the time of interview. The median stockholding value among all stock investors (including non-stockowners) was $100,000. The median number and value of listed company shareholdings among all stock investors (including non-shareowners) was three and $100,000 respectively.
-
About 10 per cent of stock investors invested in warrants2 (ie were holding warrants at the time of interview or had traded them in the 12-month period preceding the interview) and 7 per cent invested in Callable Bull/Bear Contracts (CBBCs) (ie were holding CBBCs at the time of interview or had traded them in the 12-month period preceding the interview). Collectively about 12 per cent of stock investors invested in structured products (ie warrants and/or CBBCs).
-
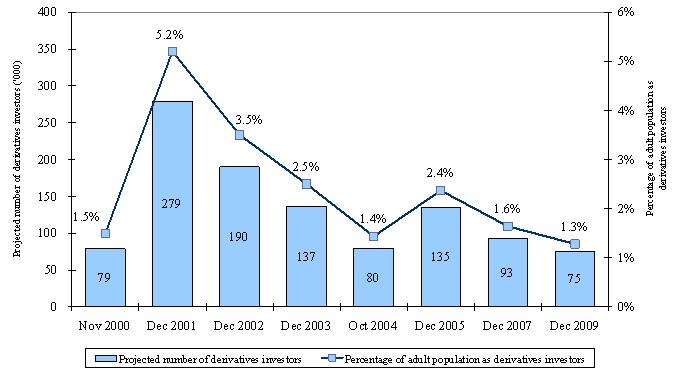
1.3 per cent of Hong Kong adults (or 75,000 individuals) were derivatives investors (individuals who
at
the time of the interview were holding futures or options traded on the HKEx derivatives market or had traded them in the 12-month period preceding the interview).3
-
Among stock investors, 84.9 per cent were stock traders
(ie had traded stocks in the 12-month period preceding the interview).
-
66.9 per cent of stock traders were online stock traders
who had traded stocks via online media during the 12-month period (up from 58.8 per cent in 2007) while 69.1 per cent of derivatives investors were online derivatives traders who had traded derivatives via online media during the 12-month period (up from 49.2 per cent in 2007).
-
69.8 per cent of stock traders had traded solely through banks
(up from 62.9 per cent in 2007) and 19.3 per cent solely through broker firms (down from 22.6 per cent in 2007). 47.9 per cent of derivatives traders had traded solely through banks (up from 36.7 per cent in 2007) and 44.2 per cent solely through broker firms (down from 48.5 per cent in 2007).
The
typical
Hong Kong
retail stock investor during the survey period was 45 years old, with matriculation or above education, a monthly personal income of about $16,250 and a monthly household income of about $35,000.
The typical
Hong Kong
retail derivatives investor was 40 years old, with matriculation or above education, a monthly personal income of about $27,500 and a monthly household income of about $45,000.
The trading pattern of stock investors in 2009 was similar to that in 2007
—
the median number of stock transactions of all stock investors in the 12-month period was 10 and the median average value per stock transaction among stock traders was $35,000, the same as in 2007. The median implied total stock transaction value per stock trader in the 12-month period was $468,0004, close to the $500,000 in 2007.
The trading pattern of derivatives investors in 2009 was also similar to that in 2007
—
the median number of deriv
at
ives transactions in the 12-month period was 10 and the median average contract volume per derivatives transaction was two, the same as in 2007. The median implied total contract volume per deriv
at
ives investor in the 12-month period was 25, lower than the 40 in 2007.5
Compared with non-online stock traders, online stock traders tended to be younger, with higher education level and higher work status. They also tended to have a larger stockholding value and to have traded more frequently.
Stock traders who traded mainly through broker firms tended to have a larger stockholding value and to have traded more frequently.
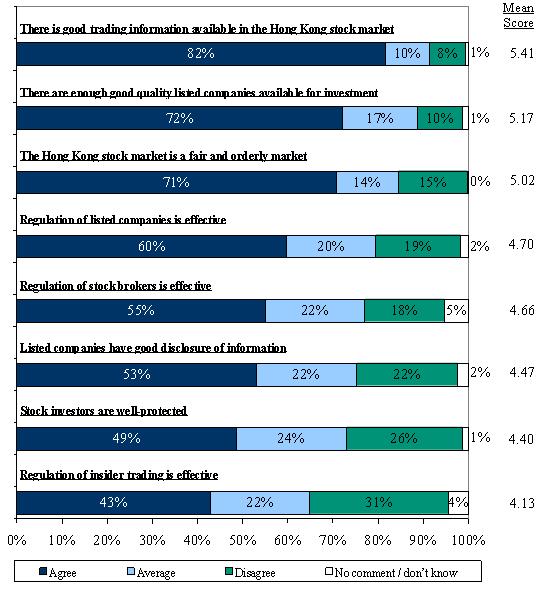
Stock investors were generally positive about the various aspects of the
Hong Kong
stock market
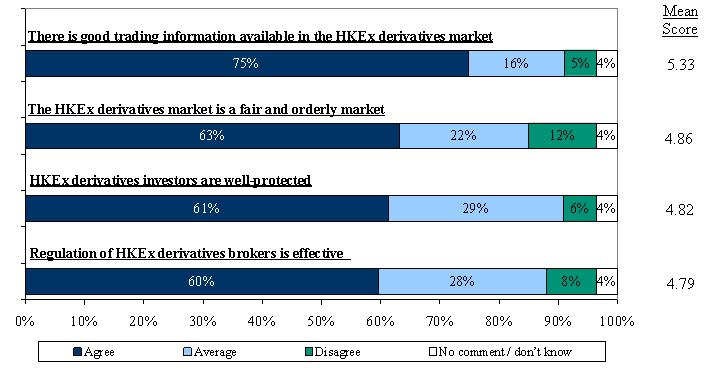
(all aspects had mean scores above 4 on a 7-point scale with 1 being strongly disagree and 7 being strongly agree). Derivatives investors were also generally positive about the various aspects of HKEx’s derivatives market
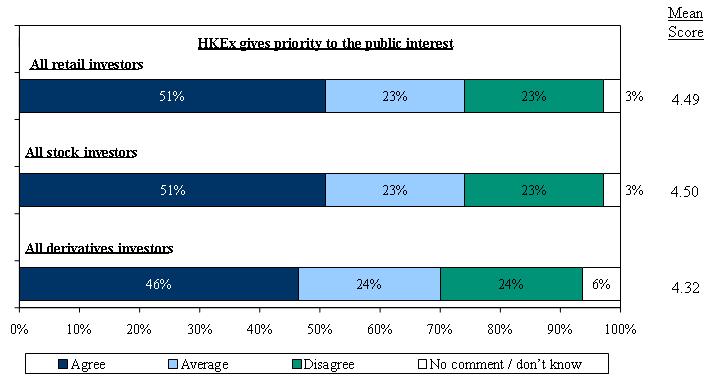
(all aspects had mean scores around 5). Retail investors were also positive when asked whether “HKEx gives priority to the public interest”.
The Retail Investor Survey has been conducted periodically since 1989. In the Retail Investor Survey 2009, 2,303 individuals were interviewed by telephone.
The full report on the Retail Investor Survey 2009 and reports on past surveys are available on the HKEx website.
Attached are selected findings of the survey presented in tables and charts.
| 1 |
The terms “Dec 2009” or “2009” are used in text, tables and charts for easy reference only. |
| 2 |
Warrants include equity warrants and derivative warrants. |
| 3 |
It should be noted that the statistics on derivatives investors are subject to relatively large error due to the small size of the sample of derivatives investors |
| 4 |
Please refer to the survey report for the detailed calculation method. |
| 5 |
Please refer to the survey report for the detailed calculation method. |
Notes:
-
Stockowners: Individuals who were,
at
the time of the interview, holding “stocks”, which are defined as products listed or traded on the HKEx securities market – including shares; warrants; Exchange Traded Funds, or ETFs; Callable Bull/Bear Contracts, or CBBCs; Real Est
at
e Investment Trusts, or REITs; and others.
-
Stockholding
: Holding of any HKEx securities market product, at the time of the interview.
-
Stock investors
: Individuals who were,
at
the time of the interview, holding stocks listed or traded on the HKEx securities market, or had traded them in the 12-month period preceding the interview.
-
Shareowners
: Individuals who were, at the time of the interview, holding equities (ie shares of listed companies) listed or traded on HKEx.
-
Listed company shareholding
: Holding of listed company shares listed/or traded on HKEx, at the time of the interview.
-
Stock traders
: Individuals who had traded stocks listed or traded on the HKEx securities market in the 12-month period preceding the interview.
-
Derivatives investors
: Individuals who were, at the time of the interview, holding futures or options traded on the HKEx derivatives market, or had traded them in the 12-month period preceding the interview.
-
The definition of online stock traders was different in minor respects in surveys before 2002. Such amendments are expected to have little material impact on the comparability of the findings.
-
Findings on derivatives investors are subject to relatively large error due to the small size of the sample of derivatives investors in the survey. Therefore, caution is needed in interpreting the findings on derivatives investors.
-
The survey assesses retail investors’ perceptions of certain aspects of the securities and derivatives markets operated by HKEx. Areas of assessment include those which would largely be outside the responsibility of HKEx, such as the regulation of brokers and the regulation of insider trading.
-
“Stock market” and “securities market” are interchangeable and refer to shares, bonds, funds, warrants, CBBCs and other products traded on The Stock Exchange of Hong Kong Limited, a wholly-owned subsidiary of HKEx.
Figure 1. Trend of stockowners and stock investors
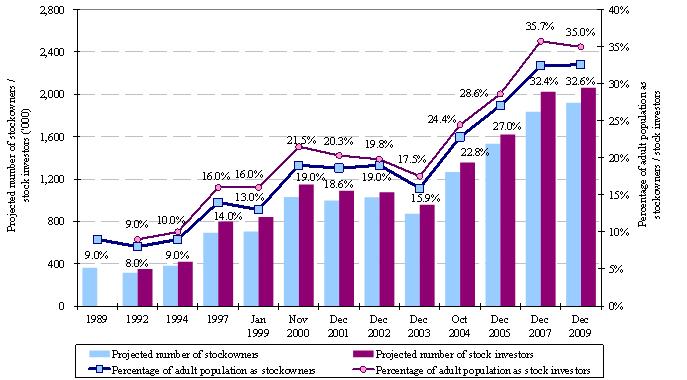
Figure 2. Trend of derivatives investors
|
Note:
|
The figures on derivatives investors presented in this chart were subject to relatively large error due to the small size of the sample of derivatives investors in the surveys. |
| Table 1. Stockholding value and stock trading pattern |
| All stock investors |
2007 |
2009 |
| Median stockholding value ($)# |
100,000 |
100,000 |
| Median number of listed company shareholdings# |
NA |
3 |
| Median value of listed company shareholdings# |
NA |
100,000 |
| Stock traders – trading in the 12-month period preceding the interview |
2007 |
2009 |
| Median number of stock transactions# |
15 |
10 |
| Median average value per stock transaction ($)# |
35,000 |
35,000 |
| Median implied total stock transaction value ($)# |
500,000 |
468,000 |
NA: Not available.
# Excluding outliers. |
| Table 2. Derivatives trading pattern of derivatives traders |
| Trading in the 12-month period preceding the interview |
2007 |
2009 |
| Median number of derivatives transactions# |
10 |
10 |
| Median average contract volume per derivatives transaction# |
2 |
2 |
| Median implied total derivatives contract volume# |
40 |
25 |
| # Excluding outliers. |
| Table 3. Stock trading channels* of stock traders |
|
2007 |
2009 |
| Mainly through banks |
69.0% |
73.5% |
| – Banks only |
62.9% |
69.8% |
| – Usually through banks |
6.1% |
3.7% |
| Mainly through broker firms |
30.0% |
25.9% |
| – Broker firms only |
22.6% |
19.3% |
| – Usually through broker firms |
7.4% |
6.5% |
| Same usage of banks and broker firms |
0.9% |
0.5% |
| Refusals |
0.1% |
0.1% |
|
*
|
Both banks and broker firms offer securities trading service to retail investors. However, banks are not Exchange Participants in HKEx’s securities markets. They have to channel orders received from investors to broker firms, which may or may not be related to the banks, for execution.
|
| Note: |
Percentages may not add up to sub-totals or 100 per cent due to rounding. |
| Table 4. Derivatives trading channels* of derivatives traders |
|
2007 |
2009 |
| Mainly through banks |
43.0% |
47.9% |
| – Banks only |
36.7% |
47.9% |
| – Usually through banks |
6.3% |
0.0% |
| Mainly through broker firms |
54.9% |
52.1% |
| – Broker firms only |
48.5% |
44.2% |
| – Usually through broker firms |
6.4% |
7.8% |
| Refusals |
2.1% |
0.0% |
|
*
|
Although banks do not directly offer derivatives trading service to retail investors, they may provide redirection service to their related broker firms (sister company in the same corporate group) on their websites or on inquiry. Investors who regard themselves trading derivatives through banks would include those using such service and those trading through broker firms with the same label as the related banks.
|
| Note: |
Percentages may not add up to sub-totals or 100 per cent due to rounding. |
| Table 5. Trading pattern of stock traders by trading channel (2009) |
| Trading in the 12-month period preceding the interview |
Mainly through
banks |
Mainly through
broker firms |
| Median number of stock transactions made* |
10 |
15 |
| Median average value per stock transaction ($)* |
40,000 |
30,000 |
| Median implied total stock transaction value($)* |
420,000 |
500,000 |
| Contribution to total stock transaction value of all stock traders |
68% |
32% |
| * Excluding outliers. |
| Table 6. Trading pattern of derivatives traders by trading channel (2009) |
| Trading in the 12-month period preceding the interview |
Mainly through
banks |
Mainly through
broker firms |
| Median number of derivatives transactions# |
4 |
24 |
| Median average contract volume per derivatives transaction# |
3 |
2 |
| Median implied total derivatives contract volume# |
20 |
60 |
| * Excluding outliers. |
Figure 3. Trend of online stock traders and online derivatives traders (2002 – 2009)
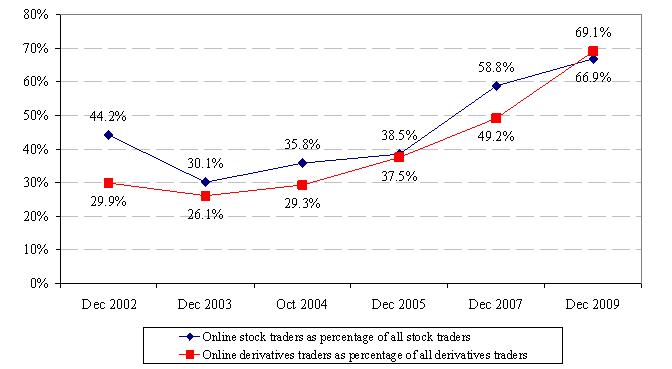
Figure 4. Perceptions of the Hong Kong
stock market by stock investors (2009)
| Notes: |
(1) |
A 7-point rating scale ranging from “Strongly Disagree” (score 1) to “Strongly Agree” (score 7) was used in the survey questionnaire. The classification into Agree (score 5-7) – Average (score 4) – Disagree (score 1-3) was used for presentation for the purpose of easy understanding. |
|
(2) |
Percentages may not add up to 100 per cent due to rounding. |
Figure 5. Perceptions of the HKEx derivatives market by derivatives investors (2009)
|
Notes:
|
(1) |
A 7-point rating scale ranging from “Strongly Disagree” (score 1) to “Strongly Agree” (score 7) was used in t
he survey questionnaire. The classification into Agree (score 5-7) – Average (score 4) – Disagree (score 1-3) was used for presentation for the purpose of easy understanding.
|
|
|
(2) |
The number of derivatives investors in the sample was small so that the percentage distribution is indicative only.
|
|
|
(3) |
Percentages may not add up to 100 per cent due to rounding. |
Figure 6. Perceptions of HKEx (2009)
|
Notes:
|
(1) |
A 7-point rating scale ranging from “Strongly Disagree” (score 1) to “Strongly Agree” (score 7) was used in t
he survey questionnaire. The classification into Agree (score 5-7) – Average (score 4) – Disagree (score 1-3) was used for presentation for the purpose of easy understanding.
|
|
|
(2) |
The number of derivatives investors in the sample was small so that the percentage distribution is indicative only.
|
|
|
(3) |
Percentages may not add up to 100% due to rounding. |