Market Turnover
-


-
-
|
|
|
|
|
|
-
-
-
Loading

One in three Hong Kong adults invests in the Hong Kong stock market

Statistics
07 Jul 2008

A survey conducted by Hong Kong Exchanges and Clearing Limited (HKEx) during the period from 16 November 2007 to 15 January 20081 revealed that one in three adults in Hong Kong are stock investors (individuals invested in the HKEx stock market).  Retail investors, ie individuals who participate in the stock or derivatives (ie futures and options) markets of HKEx or both, have risen to 35.8 per cent of the adult population, up from 28.8 per cent in 2005, according to the survey.

The Retail Investor Survey 2007 revealed that:

35.7 per cent of Hong Kong adults (or 2,022,000 individuals) were stock investors (individuals who at the time of interview were holding stocks, ie HKEx cash, or securities, market products, or had traded them in the 12-month period preceding the interview).

32.4 per cent of Hong Kong adults were stockowners who were holding stocks at the time of interview.  The median stockholding value was $100,000.

About 20 per cent of stock investors (or 7 per cent of the adult population) invested in warrants2  (ie were holding warrants at the time of interview or had traded them in the 12-month period preceding the interview).

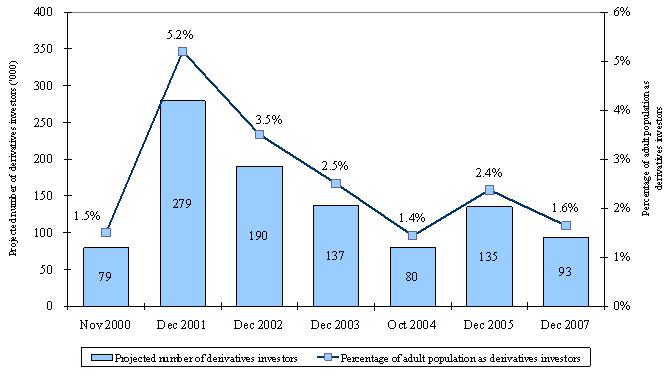
1.6 per cent of Hong Kong adults (or 93,000 individuals) were derivatives investors (individuals who at the time of the interview were holding futures or options traded on the HKEx derivatives market or had traded them in the 12-month period preceding the interview).3

Collectively, 35.8 per cent of Hong Kong adults (or 2,024,000 individuals) were retail investors who were either stock investors or derivatives investors, or both.

Among stock investors, 85.7 per cent were stock traders (ie had traded stocks in the 12-month period preceding the interview).

58.8 per cent of stock traders were online stock traders who had traded stocks via online media during the 12-month period (up from 38.5 per cent in 2005) while 49.2 per cent of derivatives investors were online derivatives traders who had traded derivatives via online media during the 12-month period (up from 37.5 per cent in 2005).

62.9 per cent of stock traders had traded solely through banks (up from 59.1 per cent in 2005) and 22.6 per cent solely through broker firms (down from 30.8 per cent in 2005).  About 48 per cent of derivatives traders had traded solely through broker firms (up from 41.2 per cent in 2005) and 36.7 per cent solely through banks (down from 48.5 per cent in 2005). 

The typical Hong Kong retail stock investor during the survey period was a 42 year-old, with upper secondary or above education, a monthly personal income of about $22,500 and a monthly household income of about $35,000.

The typical Hong Kong retail derivatives investor was a 42 year-old, with matriculation or above education, a monthly personal income of about $35,000 and a monthly household income of about $55,000.

Stock investors traded more frequently in 2007 than in 2005 — the median number of stock transactions during the 12-month period in 2007 was 10, up from five in 2005.  For stock traders only (ie excluding those who had not traded), the median number of stock transactions was 15; the average value per stock transaction during the 12-month period for a stock trader had a median of $35,000.  The median implied total stock transaction value per stock trader during the 12-month period was $500,0004, up from $340,000 in 2005.

Derivatives investors also traded more frequently in 2007 than in 2005 — the median number of derivatives transactions during the 12-month period in 2007 was 10, up from six in 20055. The average contract volume per derivatives transaction during the 12-month period for a derivatives investor had a median of two, compared to three in 2005.  The median implied total contract volume per derivatives investor during the 12-month period was 40, higher than the 24 in 2005.6

Compared to non-online stock traders, online stock traders tended to be younger, with higher education level and higher work status.  They also tended to have a higher stockholding value and to have traded more frequently.

Stock traders who traded mainly through broker firms tended to have a higher stockholding value, to have traded more frequently and with a higher deal size than those who traded mainly through banks.

Stock investors were generally positive about the various aspects of the Hong Kong stock market (all aspects had mean scores above 4 on a 7-point scale with 1 being strongly disagree and 7 being strongly agree).  Derivatives investors were also generally positive about the various aspects of HKEx’s derivatives market (all aspects had mean scores close to 5).  Retail investors were also positive when asked whether “HKEx gives priority to the public interest”.

The Retail Investor Survey has been conducted periodically since 1989.  In the Retail Investor Survey 2007, 2,292 individuals were interviewed by telephone.

A full report of the Retail Investor Survey 2007 and reports on past surveys are available on the HKEx website at: http://www.hkex.com.hk/research/research.htm.

Attached are selected findings of the survey presented in tables and charts.


1 The annotations of “Dec 2007” or “2007” are used in text, tables and charts for easy reference only.
2 Warrants include equity warrants and derivative warrants.
3 It should be noted that the statistics on derivatives investors are subject to relatively large error due to the small size of the sample of derivatives investors.
4 Please refer to the survey report for the detailed calculation method.
5 Reflecting the nature of derivatives trading, all derivatives investors had derivatives transactions during the 12-month period, ie all derivatives investors are derivatives traders.
6 Please refer to the survey report for the detailed calculation method.

Notes:

Definitions:
  1. Stockowners: Individuals who were, at the time of the interview, holding “stocks”, which are defined as instruments listed or traded on the HKEx securities market – including shares; warrants; Exchange Traded Funds, or ETFs; Callable Bull/Bear Contracts, or CBBCs; Real Estate Investment Trusts, or REITs; and others.
  2. Stock investors: Individuals who were, at the time of the interview, holding stocks listed or traded on the HKEx securities market, or had traded them in the 12-month period preceding the interview.
  3. Stock traders: Individuals who had traded stocks listed or traded on the HKEx securities market in the 12-month period preceding the interview.
4. Derivatives investors: Individuals who were, at the time of the interview, holding futures or options traded on the HKEx derivatives market, or had traded them in the 12-month period preceding the interview.
Minor amendments were made to the definition of online stock traders in surveys before 2002.  Such amendments are expected to have little material impact on the comparability of the findings.
Findings on derivatives investors are subject to relatively large error due to the small size of the sample of derivatives investors in the survey.  Therefore, caution is needed in interpreting the findings on derivatives investors.
The survey assesses retail investors’ perceptions of certain aspects of the securities and derivatives markets operated by HKEx.  Areas of assessment include those which would largely be outside the responsibilities of HKEx, such as the regulation of brokers and the regulation of insider trading.


Figure 1.  Trend of stockowners and stock investors

124 chart1


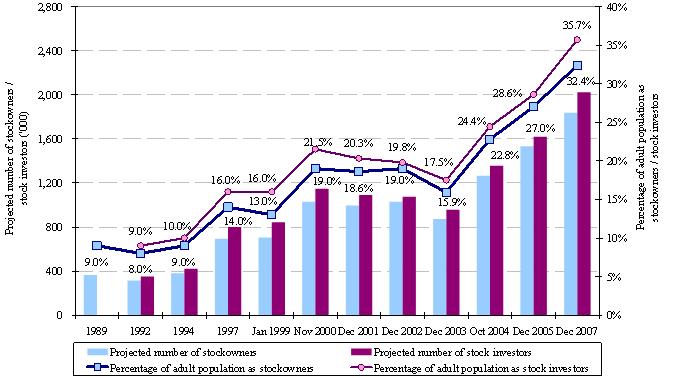
Figure 2.  Trend of derivatives investors

124 chart2

Note: The figures on derivatives investors presented in this chart are subject to relatively large error due to the small size of the sample of derivatives investors in the surveys.


Table 1.  Stockholding value and stock trading pattern
All stock investors 2007 2005
Median stockholding value ($)# 100,000 NA
Stock traders trading in the 12-month period preceding the interview 2007 2005
Median number of stock transactions# 15 10
Median of average value per stock transaction ($)# 35,000 40,000
Median implied total stock transaction value ($)# 500,000 340,000
NA: Not available.
# Excluding outliers.


Table 2.  Derivatives trading pattern of derivatives traders
Trading in the 12-month period preceding the interview 2007 2005
Median number of derivatives transactions# 10 6
Median of average number of contracts per transaction# 2 3
Median implied total contract volume# 40 24
# Excluding outliers.


Table 3.  Stock trading channels of stock traders
Stock trading channels Dec 2007 Dec 2005
Mainly through banks 69% 64%
  - Banks only 63% 59%
  - Usually through banks 6% 5%
Mainly through broker firms 30% 36%
  - Broker firms only 23% 31%
  - Usually through broker firms 7% 5%
Same usage of banks and broker firms 1% 0%
Note: Numbers may not add up to total/sub total due to rounding.


Table 4.  Derivatives trading channels of derivatives traders
Derivatives trading channels Dec 2007 Dec 2005
Mainly through banks 43% 53%
  - Banks only 37% 49%
  - Usually through banks 6% 5%
Mainly through broker firms 55% 47%
  - Broker firms only 48% 41%
  - Usually through broker firms 6% 5%
Refusals 2% 0%
Note: Numbers may not add up to total/sub total due to rounding.


Table 5.  Trading pattern of stock traders by trading channel (2007)
Trading in the 12-month period preceding the interview Mainly through
banks
Mainly through
broker firms
Median number of stock transactions made* 13 16
Median of average value per stock transactions ($)* 30,000 45,000
Median implied total transaction value ($)* 500,000 700,000
Contribution to total transaction value 61% 39%
* Excluding outliers.


Table 6.  Trading pattern of derivatives traders by trading channel (2007)
Trading in the 12-month period preceding the interview Mainly through
banks
Mainly through
broker firms
Median number of derivatives transactions made* 8 12
Median of average contract volume per derivatives transaction* 4 2
Median implied total contract volume* 40 28
* Excluding outliers.
Note:   Due to concern about reliability, certain analyses for derivatives investors by derivatives trading channel were not presented.


Figure 3.  Trend of online stock traders and online derivatives traders (2002 - 2007)

124 chart3


Figure 4.  Perceptions of theHong Kong stock market (2005 and 2007)

124 chart4

Notes:   (1) A 7-point rating scale was used in 2007 survey while an ordinal scale (agree, disagree, etc) was used in 2005.  The classification of 2007 results into Agree-Average-Disagree was for the convenience of comparison only.
 
 
(2) Numbers may not add up to 100 per cent due to rounding.


Figure 5.  Perceptions of the HKEx derivatives market (2005 and 2007)

124 chart5

Notes:   (1) A 7-point rating scale was used in 2007 survey while an ordinal scale (agree, disagree, etc) was used in 2005.  The classification into Agree-Average-Disagree was for the convenience of comparison only.
 
 
(2) The number of derivatives investors in the sample was small so that the percentage distribution is indicative only.
 
 
(3) Numbers may not add up to 100 per cent due to rounding.


Figure 6.  Perceptions of HKEx (2005 and 2007)

124 chart6

Notes:   (1) A 7-point rating scale was used in 2007 survey while an ordinal scale (agree, disagree, etc) was used in past surveys.  The classification into Agree-Average-Disagree was for the convenience of comparison only.
 
 
(2) The number of derivatives investors in the sample was small so that the percentage distribution is indicative only.
 
 
(3) Numbers may not add up to 100 per cent due to rounding.
 

Updated 07 Jul 2008